ASIC media releases are point-in-time statements. Please note the date of issue and use the internal search function on the site to check for other media releases on the same or related matters.

12-20AD Attachment - Corporate insolvencies continue to rise over 2011
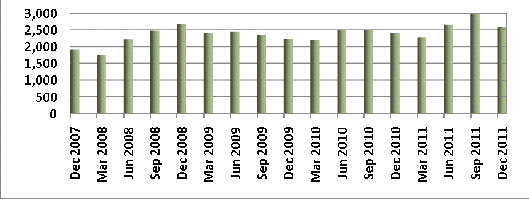
Chart 1 — Companies entering EXAD by quarter
Analysis by state — quarter ended December 2011
For the quarter to 31 December 2011, there were 2,589 external administration appointments (EXADs) - a rise of 8.1% on the 2,396 EXADs for the same quarter last financial year and a fall of 12.6% on the 2,961 EXADs in the previous quarter. The table below provides a breakdown by region:
Table 2— Companies entering into EXAD by region
|
Total |
2,396 |
2,961 |
2,589 |
100.0% |
8.1% |
-12.6% |
|
State/territory |
Number Dec qtr 2010 |
Number Sep qtr 2011 |
Number Dec qtr 2011 |
% of total Dec qtr 2011 |
% change in number Dec qtr 2010-Dec qtr 2011 |
% change in number Sept qtr 2010-Dec qtr 2011 |
|---|---|---|---|---|---|---|
|
NSW |
973 |
1,247 |
1,036 |
40.0% |
6.5% |
-16.9% |
|
Vic |
607 |
719 |
643 |
24.8% |
5.9% |
-10.6 |
|
Qld |
512 |
564 |
577 |
22.3% |
12.7% |
2.3% |
|
SA |
84 |
129 |
104 |
4.0% |
23.8% |
-19.4% |
|
WA |
170 |
218 |
167 |
6.5% |
-1.8% |
-23.4% |
|
Tas |
12 |
28 |
19 |
0.7% |
58.3% |
-32.1% |
|
NT |
6 |
8 |
9 |
0.3% |
50.0% |
12.5% |
|
ACT |
32 |
48 |
34 |
1.3% |
6.3% |
-29.2% |
NB: ASIC notes that percentage changes in smaller regions can be unduly influenced by a relatively small number of appointments.
New South Wales (+6.5%) Victoria (+5.9%), Queensland (+12.7%), South Australia (+23.8%), Tasmania (+58.3%), Northern Territory (+50.0%) and ACT (+6.3%) recorded an increase over the same quarter in the past financial year.
Only the Western Australia (-1.8%) experienced a decline in EXADs.
Analysis by appointment type – quarter ended 31 December 2011*
* excludes: scheme administrator and foreign/RAB wind-ups; and members voluntary liquidation appointments as these relate to solvent entities
Table 3 —Companies entering into EXAD (by appointment type)
|
Total |
2,395 |
2,961 |
2,589 |
8.1% |
-12.6% |
|
Appointment type |
Number Dec qtr 2010 |
Number Sep qtr 2011 |
Number Dec qtr 2011 |
% change in number Dec qtr 2010-Dec qtr 2011 |
% change in number Dec qtr 2010-Dec qtr 2011 |
|---|---|---|---|---|---|
|
Court liquidations (includes provisional liquidations) |
689 |
913 |
823 |
19.4% |
-9.9% |
|
Creditors' voluntary liquidations |
1,096 |
1,271 |
1,087 |
-0.8% |
-14.5% |
|
Receiverships (includes receivers, receivers and managers, controllers) |
282 |
390 |
289 |
2.5% |
-25.9% |
|
Voluntary administrations |
415 |
387 |
390 |
-6.0% |
0.8% |