The number of Australian companies entering into external administration fell slightly in the last quarter of the 2011-12 financial year, against a backdrop of relatively high appointments overall, according to official insolvency data published by ASIC.
Releasing the final quarterly insolvency statistics for 2011-12, ASIC’s Senior Executive Leader, Adrian Brown, said the Insolvency Practitioners team continued to monitor the capacity of registered liquidators to accommodate this additional workload and perform their duties competently and professionally.
Quarterly result
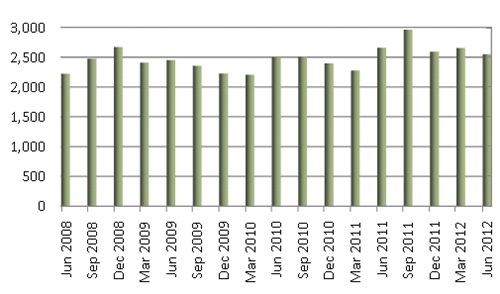
Mr Brown said there had been a small decrease in insolvency appointments from the previous quarter although the overall number of external administrations (EXADs) appointments remained relatively high (see Chart 6). Mr Brown also noted the quarterly total was down compared to the same quarter in 2010-11 (2,656) (see Table 1).
By appointment type, director-initiated creditor voluntary liquidations increased from the previous quarter (up 16.8%), offset by falls in Court liquidations (down 31.9%) and receiverships (down 6.7%). Mr Brown said this was consistent with reports of fewer wind up applications filed by the Australian Taxation Office (ATO) in the last part of the financial year; a driver of activity in earlier quarters.
Of the three larger states, the June quarterly fall in Court liquidations was most prominent in NSW and Queensland, with NSW trending down over the last 12 months and Queensland coming off a high in the March quarter. Creditor voluntary liquidations increased in the June quarter in all three of the larger states; most prominently in NSW and Victoria. Receivership appointments in Queensland remained at their highest level in the quarter above the two larger states of NSW and Victoria (see Charts 1, 2, 3 and 4).
By state and territory, only Victoria and the Australian Capital Territory (ACT) experienced an increase in EXAD appointments in the June 2012 quarter relative to the March 2012 quarter (+10.0% and +31.0% respectively) with all other states recording a decrease: New South Wales (NSW) (-3.4%), Queensland (-15.2%), South Australia (-19.3%), Western Australia (-13.0%) and Tasmania (-24.0%). There was no change in the Northern Territory (see Table 3).
Annual statistics
Data for the 2011-12 year show an increase in EXAD appointments of 9.4% compared to the 2010-11 financial year. As a proportion of the total number of registered companies, the annual increase in EXAD appointments from 2010-11 to 2011-12 was 4.8% (see Table 2)
Over 2011-12, all three of the largest states recorded rises in EXAD appointments, with the biggest rise in Queensland (21%). The rises in appointments in NSW (6.4%) and Victoria (5.4%) were below the national average of 9.4% (see Table 4).
Five-year comparison
The five year trend analysis showed a significant growth in creditor voluntary liquidations, partially offset by a reduction in voluntary administrations (see Chart 5).
‘This reflects legislative change from January 2008 streamlining a liquidator's appointment. Previously, where a director faced personal liability for tax debts via a tax penalty notice, the director could realistically only appoint a voluntary administrator to avoid that personal liability notwithstanding there were no prospects of a company restructure’, Mr Brown said.
‘Voluntary administrations and receivership appointments sit within a range of between 300 to 400 appointments per quarter since September 2009’, Mr Brown added.
Table 1— Companies entering into EXAD in June quarter 2011-12
|
Total |
2,656 |
2,552 |
-3.9% |
|
Month |
2011 |
2012 |
% |
|---|---|---|---|
|
April |
812 |
869 |
7.0% |
|
May |
817 |
884 |
8.2% |
|
June |
1,027 |
799 |
-22.2% |
Table 2— Companies entering into EXAD – five year trend (by financial year)
|
Year |
Number |
% change |
Registered companies at end of financial year |
EXADs as % of registered companies |
% Change relative to companies registered |
|---|---|---|---|---|---|
|
2007-08 |
7,907 |
5.6% |
1,645,805 |
0.48% |
0.9% |
|
2008-09 |
10,005 |
26.5% |
1,700,891 |
0.59% |
22.4% |
|
2009-10 |
9,281 |
-7.2% |
1,768,526 |
0.52% |
-10.8% |
|
2010-11 |
9,829 |
5.9% |
1,839,772 |
0.53% |
1.8% |
|
2011-12 |
10,757 |
9.4% |
1,921,545 |
0.56% |
4.8% |
Table 3— Companies entering into EXAD by region (quarterly change)
|
State / Territory |
June Qtr 2011 |
Mar Qtr 2012 |
June Qtr 2012 |
% |
% change June Qtr 2011 |
% change Mar Qtr 2012 |
|---|---|---|---|---|---|---|
|
Total |
2,656 |
2,655 |
2,552 |
100.0% |
-3.9% |
-3.9% |
|
NSW |
1,097 |
1,042 |
1,007 |
39.5% |
-8.2% |
-3.4% |
|
Vic |
706 |
658 |
724 |
28.4% |
2.5% |
10.0% |
|
Qld |
504 |
623 |
528 |
20.7% |
4.8% |
-15.2% |
|
SA |
112 |
109 |
88 |
3.4% |
-21.4% |
-19.3% |
|
WA |
176 |
162 |
141 |
5.5% |
-19.9% |
-13.0% |
|
Tas |
21 |
25 |
19 |
0.7% |
-9.5% |
-24.0% |
|
NT |
12 |
7 |
7 |
0.3% |
-41.7% |
0.0% |
|
ACT |
28 |
29 |
38 |
1.5% |
35.7% |
31.0% |
NB: ASIC notes that percentage changes in smaller regions can be unduly influenced by a relatively small number of appointments.
Table 4— Companies entering into EXAD by region (annual change)
|
Total |
9,829 |
10,757 |
9.4% |
|
State /Territory |
2010-11 |
2011-12 |
% change |
|---|---|---|---|
|
NSW |
4,072 |
4,332 |
6.4% |
|
Vic |
2,603 |
2,744 |
5.4% |
|
Qld |
1,894 |
2,292 |
21.0% |
|
SA |
352 |
430 |
22.2% |
|
WA |
681 |
688 |
1.0% |
|
Tas |
79 |
91 |
15.2% |
|
NT |
33 |
31 |
-6.1% |
|
ACT |
115 |
149 |
29.6% |
NB: ASIC notes that percentage changes in smaller regions can be unduly influenced by a relatively small number of appointments.
Table 5 —Analysis by appointment type – quarter ended 30 June 2012*
* excludes: scheme administrator and foreign/RAB wind-ups; and members voluntary liquidation appointments as these relate to solvent entities
|
Total |
2,656 |
2,655 |
2,548 |
-4.1% |
-4.0% |
|
Appointment type |
June Qtr 2011 |
Mar Qtr 2012 |
June Qtr 2012 |
% change June Qtr 2011 |
% change Mar Qtr 2012 |
|---|---|---|---|---|---|
|
Court liquidations (1) |
683 |
874 |
595 |
-12.9% |
-31.9% |
|
Creditors’ voluntary liquidations |
1,228 |
1,099 |
1,284 |
4.6% |
16.8% |
|
Receiverships (2) |
346 |
313 |
292 |
-15.6% |
-6.7% |
|
Voluntary administrations |
399 |
369 |
377 |
-5.5% |
2.2% |
(1) includes provisional liquidations
(2) includes receivers, receivers and managers, controllers and managing controllers
Charts 1,2,3 and 4—Companies entering EXAD by appointment type for NSW, Vic & Qld in 2011-12
Chart 5— Companies entering into EXAD by quarter and type of appointment
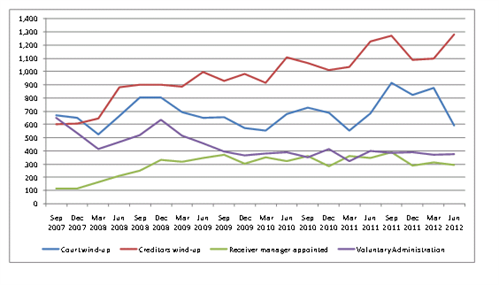
Chart 6 — Companies entering EXAD by quarter
Background
ASIC publishes monthly insolvency statistics detailing the number and type of corporate insolvency appointments. External administrators are obliged by law to notify ASIC of their appointments. This information is recorded on the public register. ASIC does not record data about the industries in which these appointments are made at the initial stage.
More information about ASIC’s insolvency data and other resources, including information for directors and creditors, is available on the ASIC website at www.asic.gov.au/insolvency.
Download: