According to figures released by ASIC today, the March 2012 quarter is the third consecutive quarter in the current financial year in which external administrations exceeded 2,500 per quarter.
ASIC’s Senior Executive Leader of the Insolvency Practitioners team, Adrian Brown, said the quarterly results show external administrator appointments remain at historically high levels.
The first quarter of the 2012 calendar year saw external administrations (EXADs) increase by 16.7 per cent (see table 1) compared to the same quarter in 2011 and is a rise of 2.5 per cent over the previous quarter, Mr Brown said.
Table 1— Companies entering into EXAD in first quarter 2012
|
Total |
2,275 |
2,655 |
16.7 |
|
Month |
2011 |
2012 |
% |
|---|---|---|---|
|
January |
455 |
518 |
13.8 |
|
February |
852 |
1,123 |
31.8 |
|
March |
968 |
1,014 |
4.8 |
Companies entering EXAD increased from 518 in January (2012) to 1,123 in February then fell slightly to 1,014 in March. January appointments reflect the fall off in activity normally associated with the Christmas/New Year holiday period.
Underpinning the March 2012 quarter statistics is a rise in court liquidation and receivership appointments. Creditors' voluntary liquidator appointments remained relatively steady while voluntary administration appointments fell.
'In terms of location, we again see a rise in Queensland with the two other largest states of New South Wales and Victoria remaining relatively steady', Mr Brown said.
ASIC publishes monthly insolvency statistics detailing the number and type of corporate insolvency appointments. External administrators are obliged by law to notify ASIC of their appointments. ASIC will provide brief commentary on its statistics quarterly throughout the 2011-12 financial year.
Further analysis of data received by ASIC follows.
More information on ASIC’s insolvency statistics
Chart 1 - Companies entering EXAD by quarter
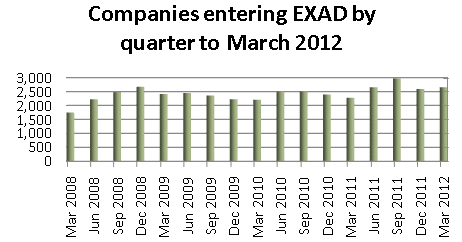
For the quarter to 31 March 2012, there were 2,655 EXADs - a rise of 16.7 per cent on the 2,275 EXADs for the same quarter last year and a rise of 2.5 per cent on the 2,589 EXADs in the previous quarter. The table below provides a breakdown by region:
Table 2— Companies entering into EXAD by region
|
Total |
2,275 |
2,589 |
2,655 |
100% |
16.7% |
2.5% |
|
State / Territory |
Mar Qtr 2011 |
Dec Qtr 2011 |
Mar Qtr 2012 |
% |
% change Mar Qtr 2011 |
% change Dec Qtr 2011 |
|---|---|---|---|---|---|---|
|
NSW |
929 |
1,036 |
1,042 |
39.2% |
12.2% |
0.6% |
|
Vic |
623 |
643 |
658 |
24.8% |
5.6% |
2.3% |
|
Qld |
404 |
577 |
623 |
23.5% |
54.2% |
8.0% |
|
SA |
68 |
104 |
109 |
4.1% |
60.3% |
4.8% |
|
WA |
189 |
167 |
162 |
6.1% |
-14.3% |
-3.0% |
|
Tas |
24 |
19 |
25 |
0.9% |
4.2% |
31.6% |
|
NT |
6 |
9 |
7 |
0.3% |
16.7% |
-22.2% |
|
ACT |
32 |
34 |
29 |
1.1% |
-9.4% |
-14.7% |
NB: ASIC notes that percentage changes in smaller regions can be unduly influenced by a relatively small number of appointments
New South Wales (+12.2 per cent) Victoria (+5.6 per cent), Queensland (+54.2 per cent), South Australia (+60.3 per cent), Tasmania (+4.2 per cent) and Northern Territory (+16.7 per cent) recorded an increase over the same quarter in the past financial year. Only Western Australia (-14.3 per cent) and ACT (-9.4 per cent) experienced a decline.
Analysis by appointment type – quarter ended 31 December 2011*
* excludes: scheme administrator and foreign/RAB wind-ups; and members voluntary liquidation appointments as these relate to solvent entities
Table 3 —Companies entering into EXAD (by appointment type)
|
Total |
2,270 |
2,589 |
2,655 |
17.0 |
2.5 |
|
Appointment type |
Mar Qtr 2011 |
Dec Qtr 2011 |
Mar Qtr 2012 |
% change Mar Qtr 2011 |
% change Dec Qtr 2011 |
|---|---|---|---|---|---|
|
Court liquidations (1) |
554 |
823 |
874 |
57.8 |
6.2 |
|
Creditors’ voluntary liquidations |
1,036 |
1,087 |
1099 |
6.1 |
1.1 |
|
Receiverships (2) |
359 |
289 |
313 |
-12.8 |
8.3 |
|
Voluntary administrations |
321 |
390 |
369 |
15 |
-5.4 |
(1) includes provisional liquidations
(2) includes receivers, receivers and managers, controllers and managing controllers