REP 807 Evaluating the state of the Australian public equity market: Evidence from data and academic literature - HTML version
Prepared by Dr Carole Comerton-Forde, Charles Lane Advisory Pty Limited for the Australian Securities and Investments Commission
February 2025
Acknowledgments and disclaimer
This report has been prepared by Charles Lane Advisory Pty Ltd (“CLA”). The information contained in this report is professional academic opinion only and is given in good faith. This report does not constitute legal advice.
The analysis presented in the report contains ASIC’s subscription data from third parties (including their use and proper attribution with permission from these third parties).
To the extent permitted by law, all liabilities are disclaimed, whether direct, indirect or consequential for any loss or damage suffered by a recipient, or other persons arising out of, or in connection with, any use or reliance on this report. No representation or warranty is made as to the accuracy, reliability or completeness of this report.
The author, Carole Comerton-Forde, is a Professor of Finance at the University of Melbourne. This report is undertaken in her private capacity and does not represent the university or its views.
This page contains:
- Executive summary
- 1. Background
- 2. Evolution of the Australian public equity market
- 3. Evolution of public equity markets in the rest of the world
- 4. Reasons for the decline of public equity markets
- 5. Is Australia different?
- 6. Other relevant developments
- 7. Risks of a shift to private
- 8. Conclusions
- Appendix A: Additional information about capital raising in other regions
- Appendix B: Additional information about private capital
- References
Executive summary
On 31 December 2024, the Australia Securities Exchange (ASX) had 1,989 domestic and foreign equity issuers listed (including all entities comprising a stapled group) with a total market capitalisation of AUD 3.007 trillion (ASX). While this market capitalisation is near record highs, the number of listed companies has decreased. This decline raises a critical question: should we be concerned?
Between December 2022 and December 2024, the number of companies has fallen by 145. This is the largest decline over a two-year period since the recession in the early 1990s. This decline was due to both fewer new listings (66) and larger numbers of de-listings (211). Neither the level of listings nor de-listings is unprecedented, but such a high ratio of de-listings to listings has only previously been observed in the early 1990s. Similarly, the amount of capital raised through Initial Public Offerings (IPOs) and Seasoned Equity Offerings (SEOs) since 2022 is lower than in recent history, but the levels are again not unprecedented.
It is too early to call this a structural shift – it may well be a cyclical trend. More concerning is the longer-term decline in the ASX market capitalisation relative to global market capitalisation, and the decline in ASX market capitalisation relative to Gross Domestic Product (GDP). ASX market capitalisation relative to global market capitalisation fell from 2.1% in 2013 to 1.6% in 2023, and ASX market capitalisation to GDP fell from a peak of 140% in 2006 to 103% in 2023.
The public market landscape is very different in the United States (US) and two European markets examined (the United Kingdom (UK) and France). The US has experienced a very clear structural decline in the number of public companies since the late 1990s/early 2000s. A similar structural decline occurred in the UK and France around 2008. Three Asian markets: Singapore, Hong Kong and China, and the Canadian market do not exhibit these structural changes, but like Australia have experienced reduced public market activity in the last few years.
A vast academic literature has studied the reasons for the decline of the US public market. Contrary to public commentary, rising regulatory costs attributed to the Sarbanes Oxley Act 2002, are not the primary driver of this change. Instead, reductions in regulatory barriers in private markets, leading to substantial increases in the amounts of private capital, and changes in the nature of companies are shown to be the main contributor to companies choosing to stay private for longer. Companies have become less capital-intensive as intangibles have become more important, meaning that capital requirements have changed. Greater weight on intangible assets also means that companies have become harder to value, making investments from sophisticated investors with technical expertise in private markets more attractive. The abundance of private capital has also enabled founders to retain higher ownership stakes, giving them more voice in the decision about whether or not to go public.
While similar academic research is not available for the Australian market, there are some similarities with the US markets, but also many differences. First, the Australian public market has historically catered to much smaller companies – making the market more similar to the US venture capital (VC) market than the US public market. Nearly 80% of capital raised by IPOs over the last 20 years is for companies with market capitalisations of less than AUD 75m. Second, Australia-focussed private capital funds have grown substantially (350% from 2010 to June 2023) but remains modest at AUD 139 billion or 2.5% of public equity market capitalisation. Third, Australia has not had substantial increases in the regulation of public companies over the short period of decline in our public markets.
The size and scale of the Australian superannuation sector is also an important factor to consider. The superannuation sector has become a significant player in private asset markets. The largest super funds allocate nearly a quarter of their assets to private markets and have publicly stated plans to allocate more assets to private markets in the future. This means the retirement savings of Australian investors are significantly exposed to a less transparent asset class. This raises questions about whether the light regulatory touch applied to this asset class remains appropriate.
The rise of private markets may lead some to conclude that private market return performance is superior to that of public markets. However, the evidence for this is far from clear. While early vintages of private funds earned net of fee returns in excess of public markets, more recent vintages appear to only earn net of fee returns similar to public markets. This comparison does not consider differences in risk, leverage or illiquidity.
There are risks to a substantial shift away from public toward private markets:
- Capital allocation may be less efficient: Some academic evidence indicates that public markets allocate capital more efficiently than private markets. Therefore, a large shift in assets to private markets may make overall capital allocation less efficient.
- Wealth creation is not accessible to all investors: Historically private markets are only available to accredited investors. This means that other investors do not have access to the wealth creation opportunities that occur in private markets.
- Expansion to all investors creates risks: Increasingly private market access is expanding to all investors either indirectly through super funds or directly through new products made available to less sophisticated investors. This places a burden on super funds and financial advisors to ensure that these customers understand the risk and return profile of these products.
- Less transparency about companies and valuations: Private companies have fewer financial reporting and governance obligations. This means private company activities and valuations are less transparent.
- Fees and leakage of economic value: Private market funds charge substantially higher fees than public market funds. This represents a potentially substantial leakage in economic value from investors.
One of the major limitations of private market investments is a lack of liquidity. Financial market innovation has seen the launch of secondary trading platforms for private assets, secondary markets for private equity fund stakes, and new continuation funds where assets can be transferred from one fund to another. These innovations are valuable for private market investors; however, they create additional disincentives for companies to go public. They also raise questions about potential conflicts of interest when assets are transferred between funds without a public price discovery process.
The analysis presented in this paper suggests that media commentary about the decline of the Australian public market appears to be overstated. However, there is reason for caution and further investigation and research into the evolution of public markets in Australia is warranted.
1. Background
The financial media and some market commentators have been popularising the story that the Australian public equity market is in decline [Note 1]. Similar headlines have also been common in other parts of the world [Note 2]. Are these headlines supported by empirical evidence? And is there reason for concern about the state of the Australian public equity market?
This paper seeks to address these questions. It begins with a deep dive into the data on listings, de-listings and capital raisings on the Australian Securities Exchange (ASX) over the last thirty-five years. Next, it contrasts the Australian experience with four mature markets: the United States (US), Canada, the United Kingdom (UK) and France. It also contrasts these experiences with those in three regional markets: Singapore, Hong Kong and China.
Having documented the facts about the evolution of public markets, the paper next reviews the academic literature on capital raising in both public and private markets. This includes analysis of the reasons for declining Initial Public Offerings (IPOs) and rising private market investments. This research predominantly focuses on the US market. Therefore, the subsequent section explores whether Australia is different and considers the relevance of the US findings to the Australian context. The next two sections discuss innovations aimed at making private markets more liquid and highlights the potential risks of a shift of assets from public to private markets.
2. Evolution of the Australian public equity market
This section describes the history of capital raising in Australia, both through Initial Public Offerings (IPOs) and Seasoned Equity Offerings (SEOs) through rights issues, private placements and dividend reinvestment schemes. It also summarises secondary market trading activities.
2.1 Public market capital raising
A complete picture of the Australian public equity market is difficult to assemble due to inconsistencies in these data across different sources. The following section provides a summary of Australian listings and capital raisings and the size of the overall market. Each piece of analysis identifies the data set used, but efforts have not been made to reconcile the differences between the data sets.
Figure 1 [Note 3] reports the number of listed entities on the ASX over the period 31 December 1990 to 31 December 2024. Two sets of the results are reported. The first includes only listed companies and the second also includes Listed Investment Companies (LICs), Listed Investment Trusts (LITs) and Real Estate Investment Trusts (REITs). The trends in the two lines are similar, with an uptick in the number of LICs, LITs and REITs in the early 2000s. Given this paper focusses on capital raising for companies, rather than investment vehicles, analysis of the changes in listings over time excludes LICs, LITs and REITs [Note 4].
Figure 1 shows that the number of listings fell by an average of 135 companies per year between 1990 and 1992, likely due to the recession. For the next ten years, the number of listed companies grew by an average of 35 companies per year. This rose to an average of 50 companies per year from 2003 to 2012. Between 2013 and 2022 the average number of listed companies grew only, on average, by 10 companies per year. The number of listed companies fell by 145 from January 2023 to December 2024. This was the largest two-year decline since the recession in the early 1990s.
Figure 1: Number of listed companies on ASX
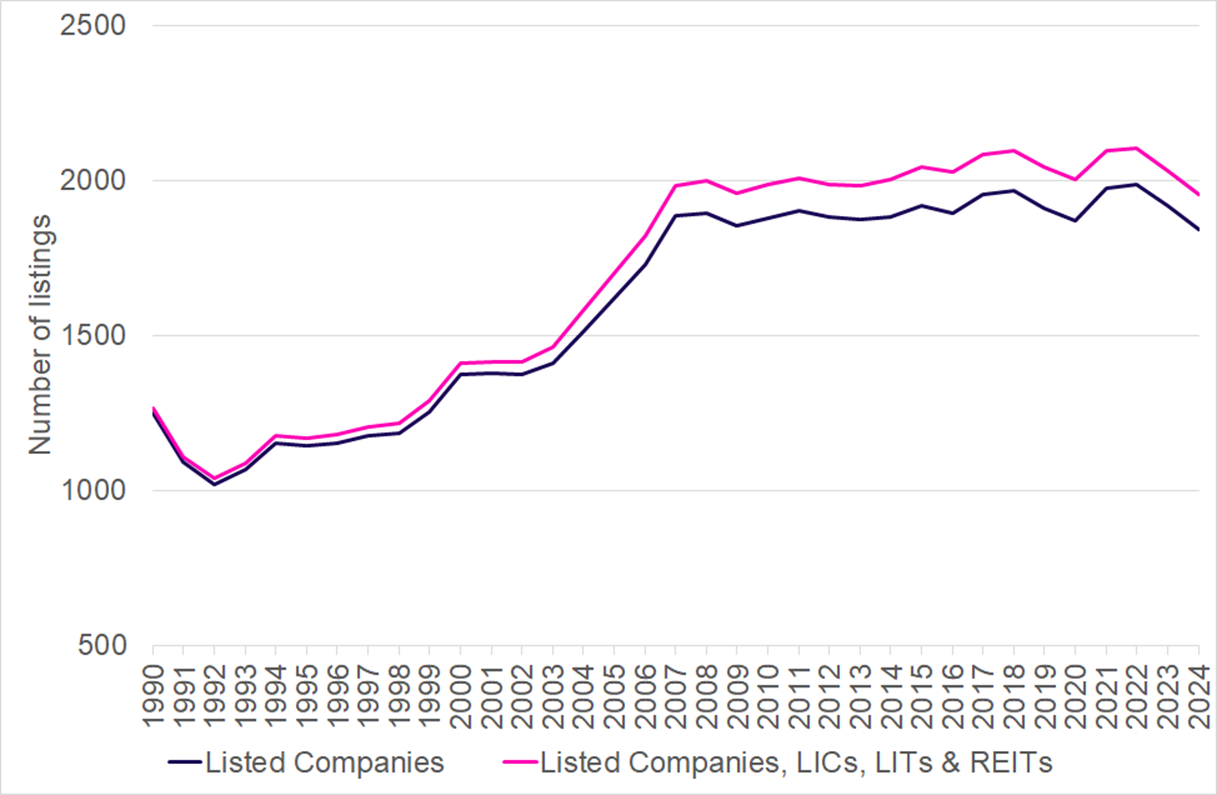
Source: Morningstar DatAnalysis
Figure 2 [Note 5] shows the number of new listings and de-listings over the period 1 January 1990 to 31 December 2024. This shows that there were large numbers of de-listings in 1990, 1991 and 1992, likely due to the recession. Outside of this period, the peak year for listings was 2007 with 257 new listings and the peak year for de-listings was 2020 with 124 de-listings. The large number of de-listings in 2019 and 2020 is due to ASX activating a rule to automatically de-list companies that have been suspended for over two years (Benbow, 5% of ASX-listed companies de-listed in 2019-20, William Buck, 4 August 2020 ).
Since the early 1990s recession, ten individual years saw negative net listings. Four of these occurred in the last six years, including -75 net listings in 2024. Additional analysis of the reasons for de-listings would be informative but requires these data to be hand-collected from press reports and other sources [Note 6].
Figure 2: Number of new listings and delistings on ASX
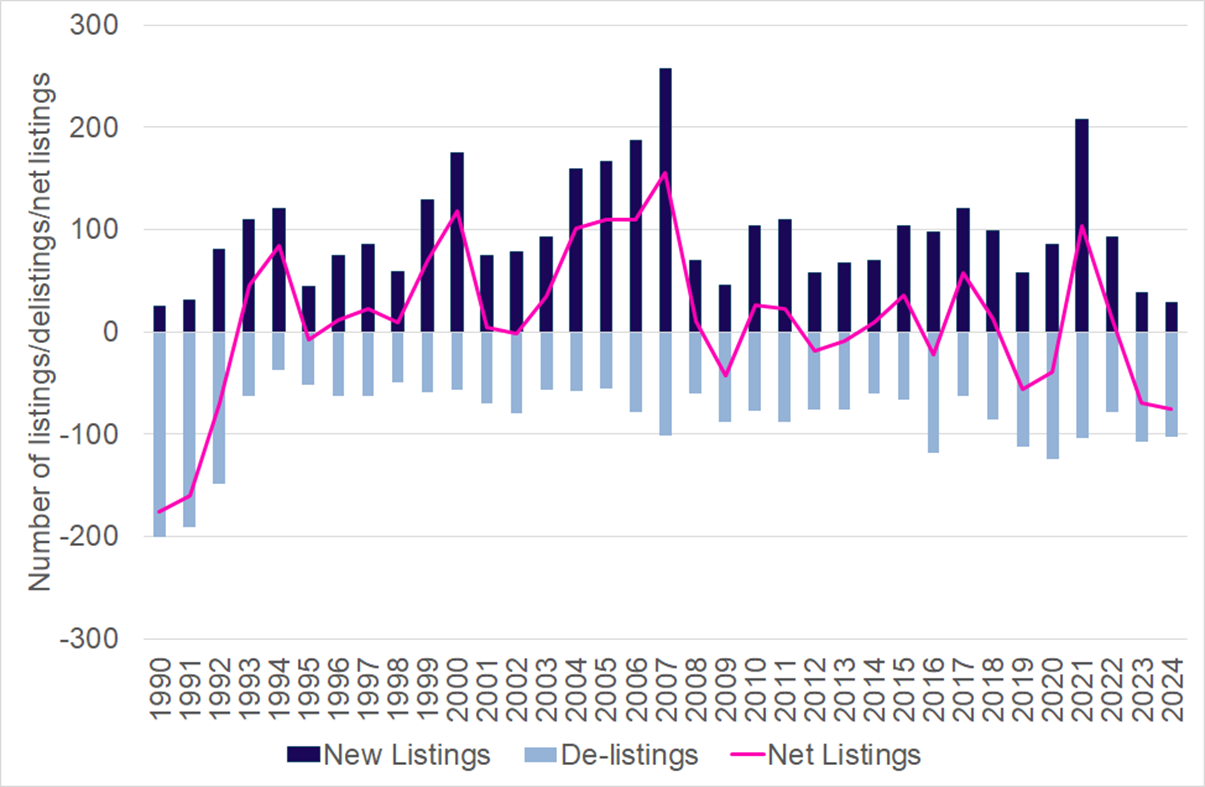
Source: Morningstar DatAnalysis
Figure 3 [Note 7] reports the amount of capital raised in Australia via IPOs over the period 1990 to 31 December 2024. The peak capital raised for IPOs was in 1997 with AUD 18.8 billion raised, 72% of which related to the Telstra privatisation. The next largest year was 2014 at AUD 17.3 billion. The number of IPOs is only moderately correlated (47%) with the amount of new capital raised through IPOs. 2007 was the peak year in terms of the number of IPOs, but it ranked only as the 11th year in terms of IPO capital raised. 2021 was the next largest number of IPOs and represented the fifth largest year in terms of capital raised. The amount of capital raised in 2022 and 2023 was at the lowest levels observed since 2012. The amount raised in 2024 was buoyed by three large listings: DigiCo Infrastructure REIT (AUD 1.995 billion), Cuscal Ltd (AUD 336 million) and Guzman Y Gomez Holdings Ltd (AUD 334 million).
Gilbey, Marsh and Purchase (2022) provide a detailed investigation of ASX IPOs over the period 1999 to 2019. They show that of the AUD 214 billion raised during this period, 78% related to companies with a market capitalisation of less than AUD 75 million, which they describe as small/micro-cap. In a subsequent study examining the period 1999 to 2022, Marsh and Gilbey (2023) show that the average issue size was AUD 109.4 million. They also provide a breakdown of IPOs by industry. Metals and Mining stocks accounted for the largest number of IPOs at 860, with around AUD 25 billion capital raised. More capital was raised by Software, BioTech and Tech Hardware at AUD 26.4 billion, across 312 IPOs. The next largest industry in terms of capital raised was Diversified Financials at around AUD 24 billion (138 IPOs), and in terms of the number of IPOs was Energy at 206, (with approximately AUD 15 billion raised).
Marsh and Gilbey (2023) also report that the average time from incorporation to IPO is four years, although there is substantial variation by industry. Insurance companies and banks are the most “mature” when they list at 21.3 and 17 years since incorporation, respectively, compared to only 3.1 and 3.2 years for Metals and Mining, and Utilities, respectively. They do not report how the time between incorporation and listing has changed over time.
Figure 3: Number of IPOs and new capital raised on ASX
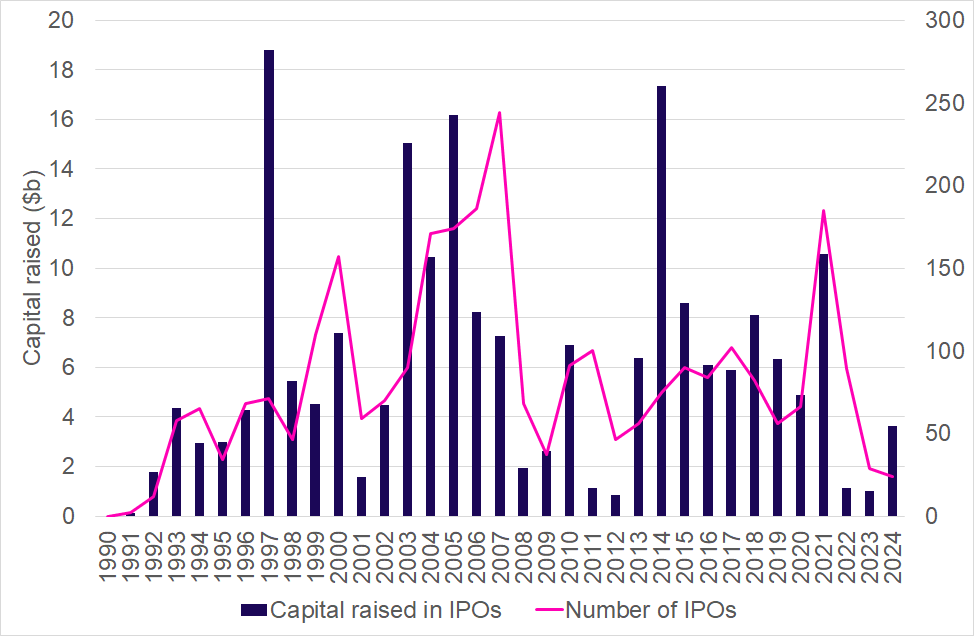
Source: Bloomberg
Once listed, how long do Australian companies typically remain listed, and has this changed over time? Figure 4 [Note 8] reports the fraction of companies listed in a given decade that “survive” five, 10 and 15 years. A company is considered to “survive” if it remains listed for that period of time. Companies listed in the 1990s and 2000s have the best survival rates. Eighty four percent (85%) of companies listed in the 1990s (2000s) survived at least five years. This fell to 73% (76%) for 7.5 years, 63% (69%) for 10 years and 48% (51%) for 15 years for companies listed in the 1990s and 2000s respectively [Note 9]. Companies listed in the 2010s have had lower survival rates. Only 50% of companies have survived more than 7.5 years, and only 28% have survived 10 years. Additional analysis of the industry trends in the survival rates would be useful but is beyond the scope of this paper.
Figure 4: Survival rate of listed companies on ASX
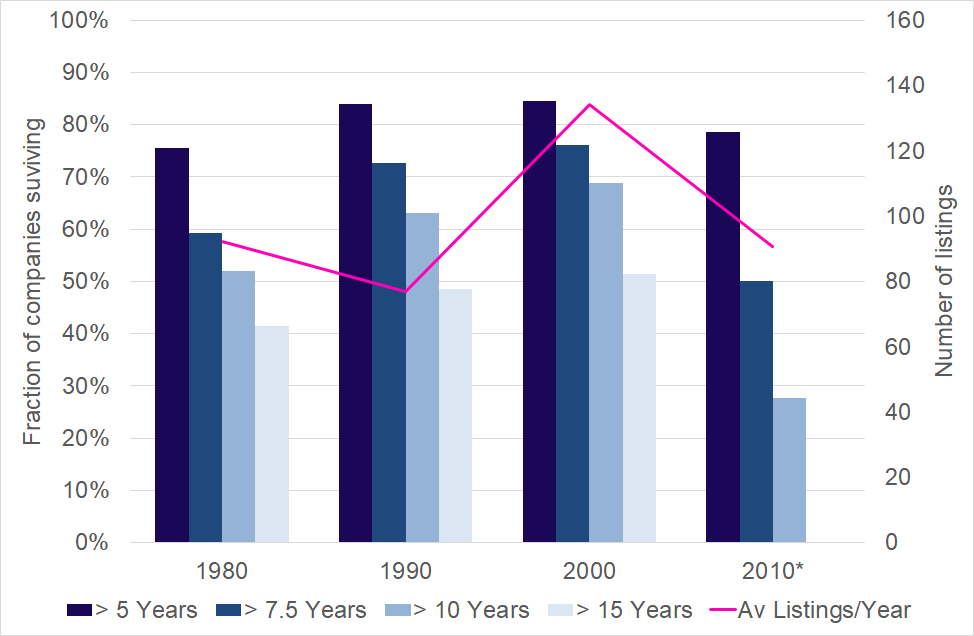
Source: Morningstar DatAnalysis
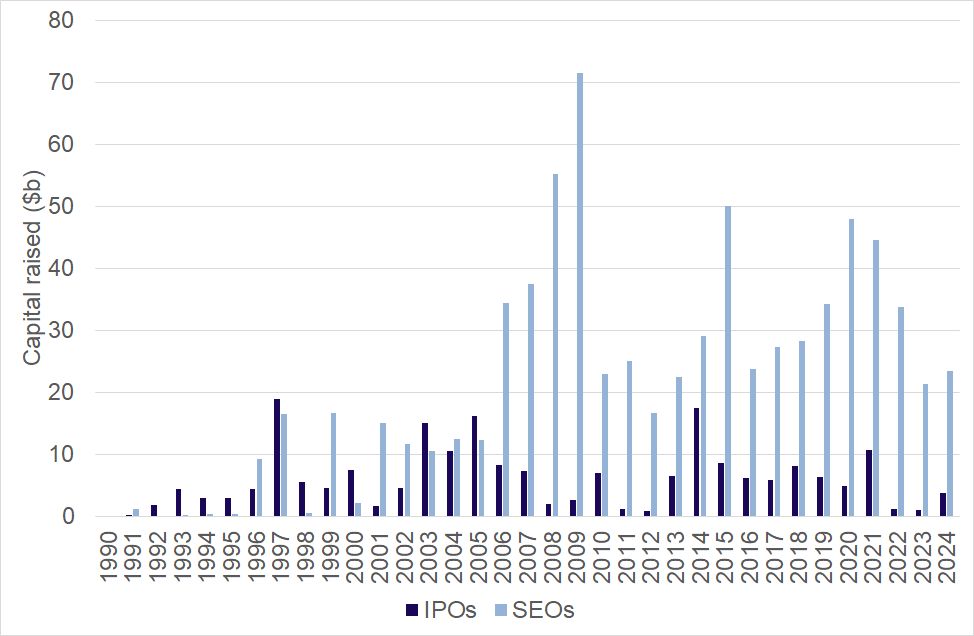
Figure 5 [Note 10] reports the amount of IPO capital raised compared to Seasoned Equity Offerings (SEOs) over the period 1990 to 31 December 2024 [Note 11]. This shows that since 2006, the amount of capital raised via SEOs substantially exceeds that raised via IPOs. This is particularly apparent during the financial crisis in 2007 and 2008 where listed companies raised substantial amounts of capital via SEOs, but there was little IPO capital raised. Post the financial crisis, 2015 and 2020 saw the largest amounts of SEO capital raised at AUD 50 billion and AUD 48 billion, respectively. SEO capital raising declined each year from 2020 to 2023 but increased in 2024 relative to 2023.
The ease with which large amounts of secondary capital are raised is due, at least in part, to the unique accelerated secondary capital raising structures available in Australia. Listed companies can raise capital quickly with accelerated rights offerings and private placements, without requiring shareholder approval. Capital raising during COVID was supported by the temporary capital raising relief provided by ASX and ASIC, which allowed companies to raise larger amounts of capital without shareholder approval (ASIC Media Release 20-075MR).
Figure 5: Capital raised in IPOs and SEOs on ASX
Source: Bloomberg
In its most recent full year results presentation, ASX reported capital raising statistics for the period 2017 to 2023. These statistics are reproduced in Figure 6. Over this short sample period net capital raised ranged between a low of AUD 19 billion in 2023 and a high of AUD 107 billion in 2022. These statistics are not directly comparable to the earlier statistics that rely on Bloomberg because ASX includes scrip-for-scrip deals in their calculations. In 2022, ASX also included AUD 96 billion related to a scheme of arrangement to unify BHP’s dual-listed company structure to a single listing on ASX. If this transaction had been excluded from the analysis, 2022 would have had the lowest amount of net capital raised at AUD 10 billion. A longer time series of these data, excluding scrip-for-scrip deals would be informative for understanding the changes in net capital. However, data on market capitalisation at de-listing date is not consistently available in public databases.
Figure 6: Net capital raised on ASX
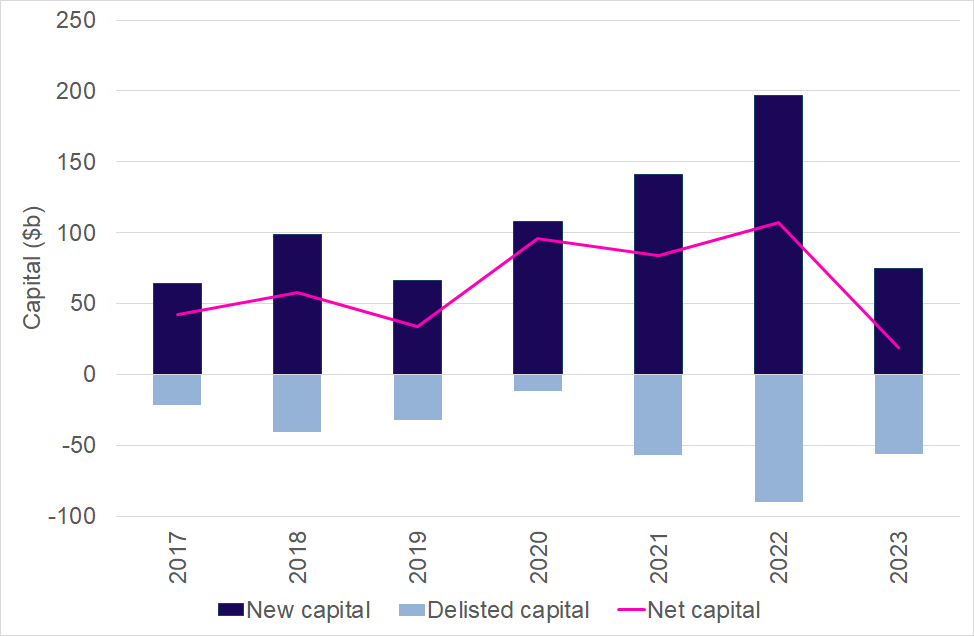
Source: ASX Full Year Results Presentation, 2024
The size of the market relative to Gross Domestic Product (GDP) is a useful indicator of the scale of the market relative to the national economy. Figure 7 reports this statistic for the ASX over the period 1990 to 2023. This proportion grew steadily from 33% in 1990, peaking at 140% in 2006. It declined sharply to 65% in 2008, and at the end of 2023 was approximately 103%. While this is in line with the average over the last 20 years, it is substantially below its peak. Figure 7 also reports the ASX’s share of global equity market capitalisation from 2013 to 2023. Australia’s share of global capitalisation fell from 2.1% in 2013 to only 1.6% at the end of 2023. This is approximately in line with Australia’s share of global GDP. These statistics suggest that the Australian public market is less important than it was relative to the size of our domestic economy 20 years ago and is now a smaller contributor to global markets than it has been for most of the last decade.
Figure 7: ASX Market cap relative to GDP and global equity market cap
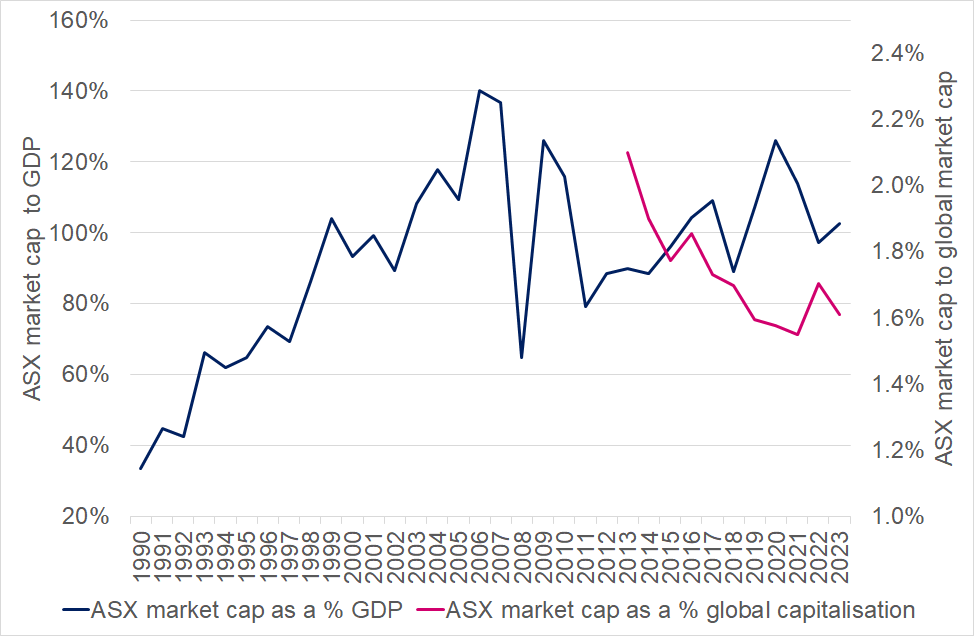
Source: World Federation of Exchanges, Statista
Overall takeaways: The ASX has been successful in attracting companies (particularly smaller companies) to the market, consistently over time. There has been a reduction in the number of new listings and an increase in the number of de-listings in recent years resulting in a modest overall decline in the number of companies listed. The total capital raised through IPOs has declined substantially in the last three years. However, these reduced levels of activity are not unprecedented. It is too early to argue that this is a permanent change in the Australian market. The amount of capital raised in SEOs dominates IPOs, with listed companies able to raise capital quickly during crisis periods (e.g. financial crisis and COVID). The volume of SEO capital has also declined in recent years, but again these lower levels are not unprecedented. More troubling than the decline in the number of listings is the longer-term decline in the ASX market capitalisation relative to world market capitalisation, and the stagnation in market capitalisation relative to GDP.
2.2 Public market secondary activities
Once listed, companies enjoy the benefits of secondary market trading, which offers opportunities for liquidity and price discovery. The quality of the secondary market can have a direct impact on the cost of raising capital (Brugler, Comerton-Forde and Hendershott (2021); Brugler, Comerton-Forde and Martin, 2022). Therefore, it is useful to consider how the state of the secondary market has changed over time. This section reports on trading activity, bid ask spreads and order book depth on ASX and Cboe Australia.
ASIC reports quarterly statistics on the quality of the Australian equities market on its website [Note 12]. Figure 8 reports the aggregate daily market turnover and number of trades for all ASX listed companies on a monthly basis from October 2013 to March 2024. This shows that both turnover and trade frequency have trended up over the period. Activity peaked in March 2020 due to COVID-related volatility. Since the COVID-peak, activity has remained at more subdued levels and has no longer continued to grow at the rate observed pre-COVID.
Figure 8: Secondary market trading activity in Australia
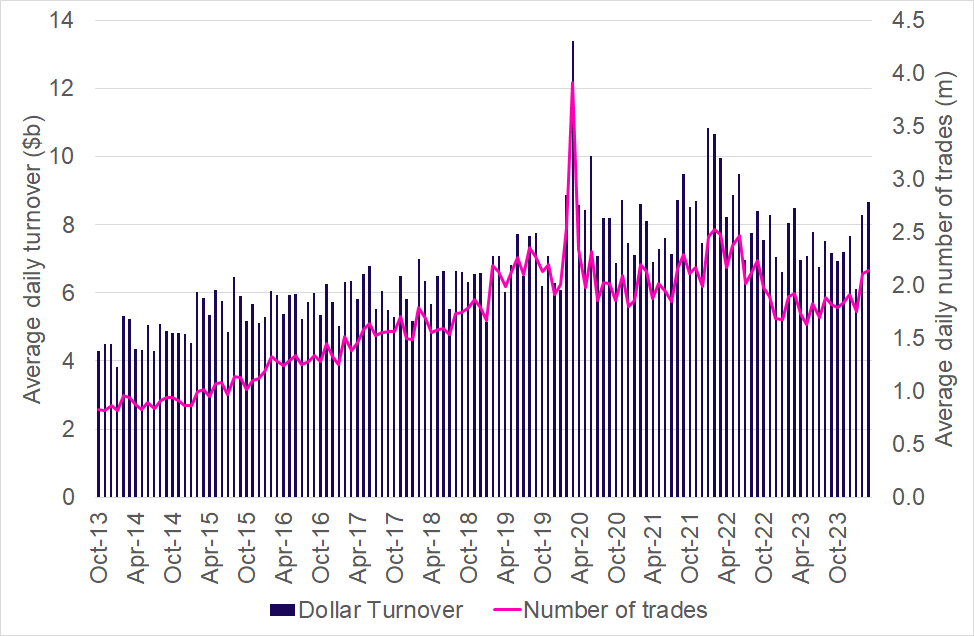
Source: ASIC Equity Market Data
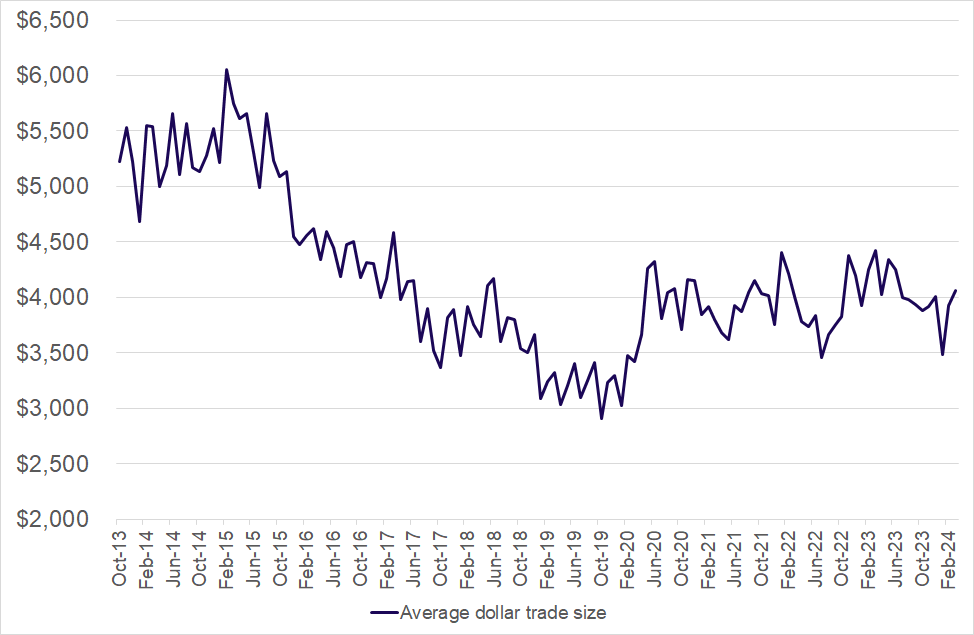
Figure 9 shows that the average trade size has declined from around AUD 5,200 to AUD 4,000. This reflects the growing use of trading algorithms by institutional investors to slice up their orders to minimise the impact that their orders have on the market. Trade size declined rapidly between March 2015 and February 2020, to around AUD 3,000. The increase in early 2020 may be due to increased participation by retail investors who tend to trade in larger trade sizes than the average institutional trader.
Figure 9: Average trade size in Australia
Source: ASIC Equity Market Data
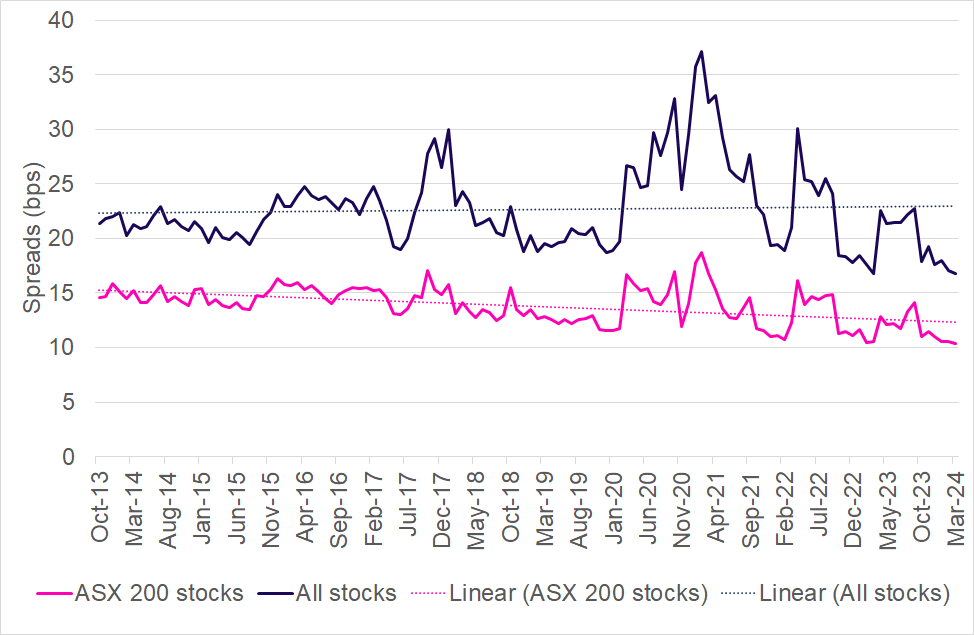
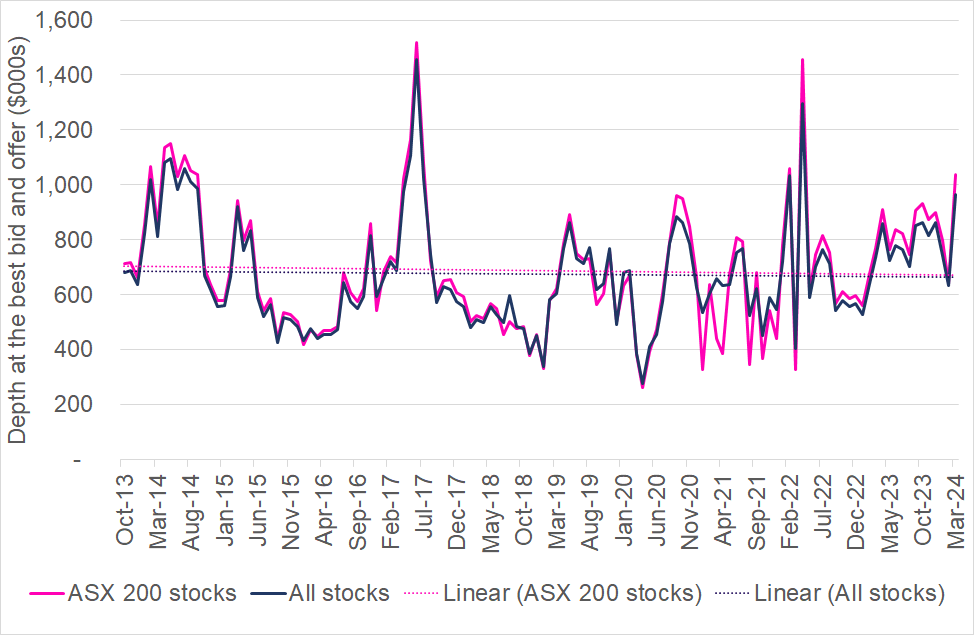
What has happened to market liquidity over the same period? Liquidity is proxied by the quoted bid ask spreads [Note 13] and the quoted depth [Note 14]. The quoted bid ask spread captures the average cost of trading immediately, and the quoted depth indicates the amount that can be traded immediately at that price. Figure 10 reports the value-weighted quoted spreads for all stocks listed in the market and for the top 200 securities by turnover. This shows that for the top 200 stocks quoted spreads have trended down from around 15 bps to 10bps, indicating that liquidity for these stocks has improved. For the market in aggregate, quoted spreads have remained stagnant. Given these statistics are value-weighted across stocks, this implies that liquidity for stocks outside the top 200 has declined over this period. Figure 11 shows that quoted depths are highly variable but exhibit no clear trend over the period. There is little difference between the quoted depth for the top 200 stocks vs the market aggregate. The similarity in the statistics for the two groups of stocks is a function of the value-weighting that has been used in this calculation.
Figure 10: Quoted spreads in Australia
Source: ASIC Equity Market Data
Figure 11: Quoted depth in Australia
Source: ASIC Equity Market Data
Overall takeaways: The overall trading activity and liquidity of the Australian market has been stable in recent years. Liquidity in large-cap stocks has improved, which means smaller-cap liquidity has declined. Given the importance of small- and micro-cap stocks in the Australian market, further analysis of the liquidity at the smaller end of the market may be warranted and if necessary, consideration given to strategies for enhancing small-cap liquidity. Additional analysis to understand the impact of the concentration of large investors including super funds, index funds and exchange traded funds may also be informative for understanding changes in liquidity.
3. Evolution of public equity markets in the rest of the world
Global public markets have exhibited a number of trends over the last decade or two. The first trend is the decline in the number of listings. The second is increased concentration at a country, sector and stock level. The third is the growing importance of index investing. This section describes these trends.
3.1 Declining number of listed companies
Concerns about declining numbers of listings in the US date back to the late 1990s, while concerns in other parts of the world are more recent. This section documents statistics on the number of IPOs and SEOs, and amounts of capital raised through these mechanisms in four global markets: the US, Canada, the UK, France; and three regional markets: Singapore, Hong Kong and China.
A great deal has been written about the decline in the number of companies listed in the US equities market. The number of companies listed in 1976 was just under 4,800, rising to more than 7,300 in 1996. Since that time the number of listed companies has fallen by more than 40% to 4200 (in 2022). Doidge, Karolyi and Stulz (2017) and Mauboussin and Callahan (2023) provide further details on these trends. The financial press has typically attributed this decline to increasing regulations and costs associated with being listed, particularly the Sarbanes Oxley introduced in 2002. However, the decline pre-dates this change in regulation.
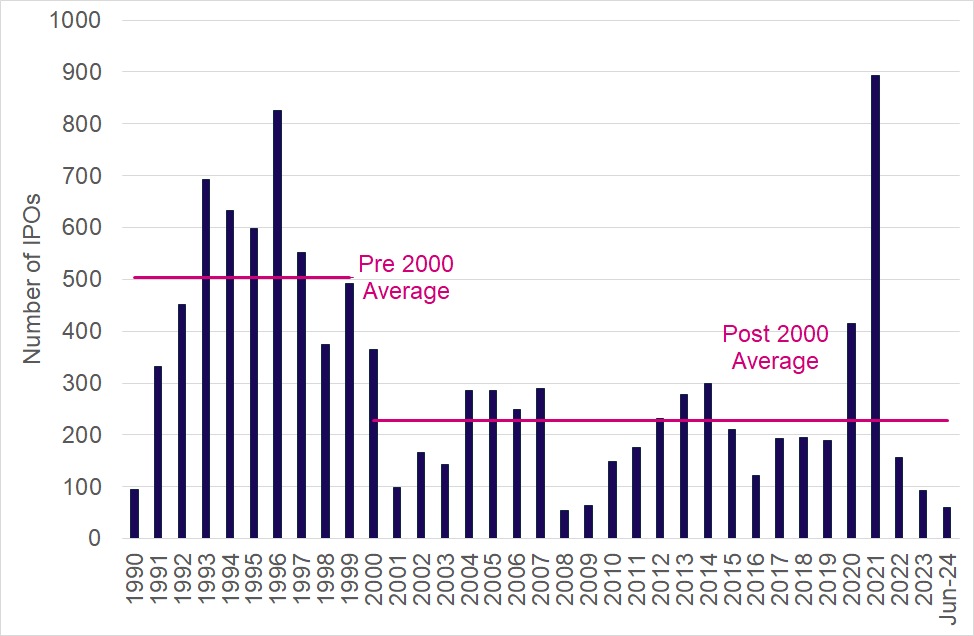
This decline is evident in the IPO statistics. Figure 12 [Note 15] reports the number of IPOs in the US from 1990 to June 2024. Prior to 2000, approximately 504 companies were listed, on average, each year. From 2000 this declined to only 229 companies per year, on average. Despite this overall trend, the peak year for IPOs was 2021, with 894 new companies listed. Although the number of listings in 2022 to 2024 are low, they are not at unprecedented levels. SEOs do not exhibit a similar patten (Figure 13), with an overall upward trend over the sample period. However, the number of SEOs between 2022 and June 2024 is lower than most of the prior decade.
Figure 12: Number of IPOs in the United States
Source: Bloomberg
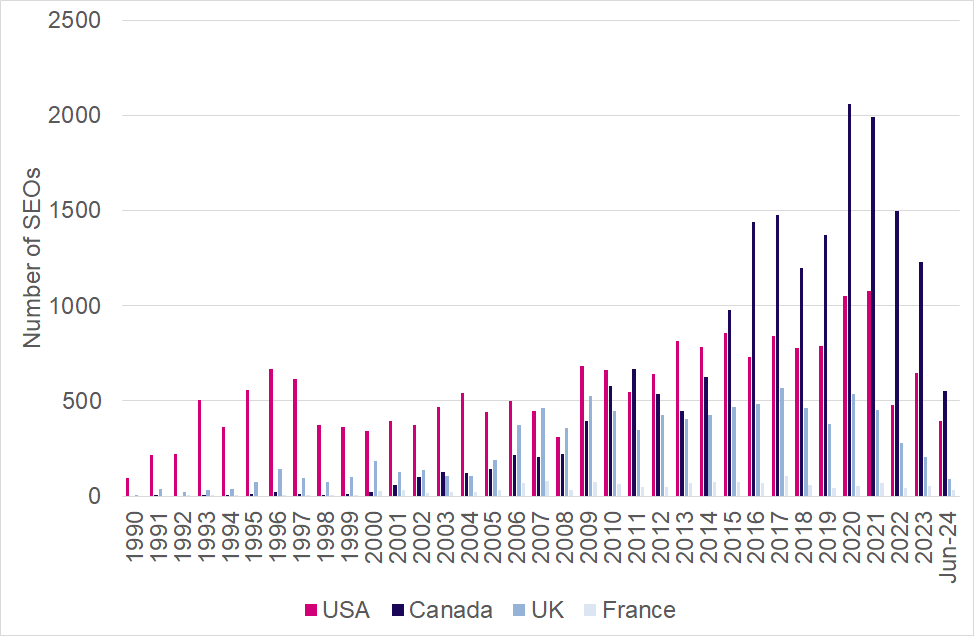
Figure 13: Number of SEOs in the US, Canada the UK and France
Source: Bloomberg
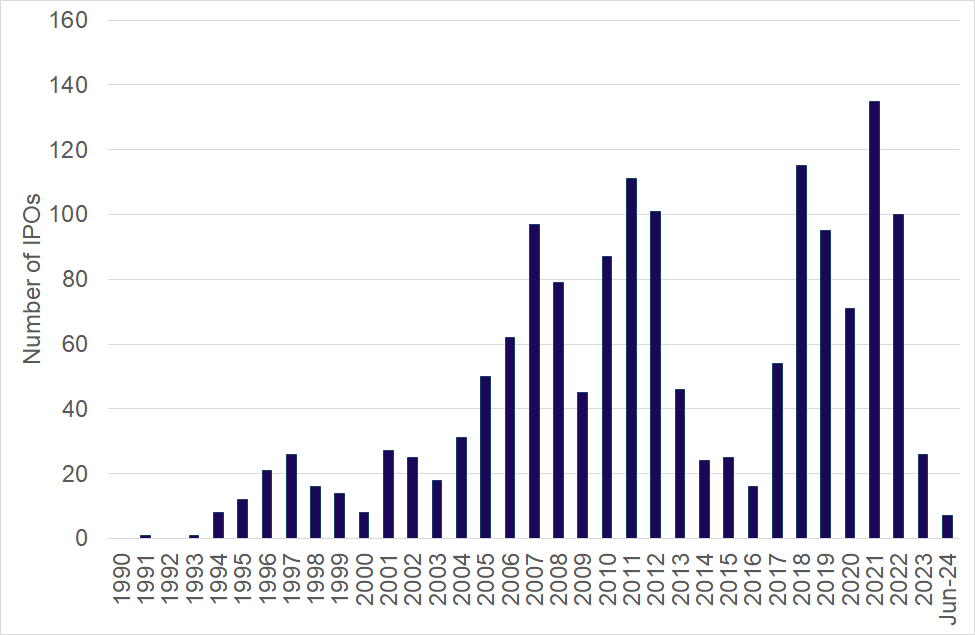
Canada shows quite a different pattern in the number of IPOs compared to the US [Note 16]. Figure 14 shows that there are no obvious structural breaks in Canada during the period. The number of IPOs prior to 2000 is very low. The number trends up until 2007 but declines during the financial crisis in 2008 and 2009. IPOs return to pre-financial crisis levels between 2010 and 2012. IPOs were again low between 2013 and 2017. Like the US and Australia, the number of IPOs in Canada peaked in 2021 (at 135). 2022 was also a strong year but IPOs fell to 26 and 7 for 2023 and the six months to June 2024. Figure 13 shows that after 2000, Canada exhibited a similar trend in SEOs to that observed in the US. SEOs in Canada grew fairly consistently from 2000 to 2020, peaking at 2058 SEOs. In 2021 there were 1993 SEOs, however, the numbers declined substantially after 2022. Between 2015 and June 2024, the number of SEOs in Canada exceeded the number in the US.
Figure 14: Number of IPOs in Canada
Source: Bloomberg
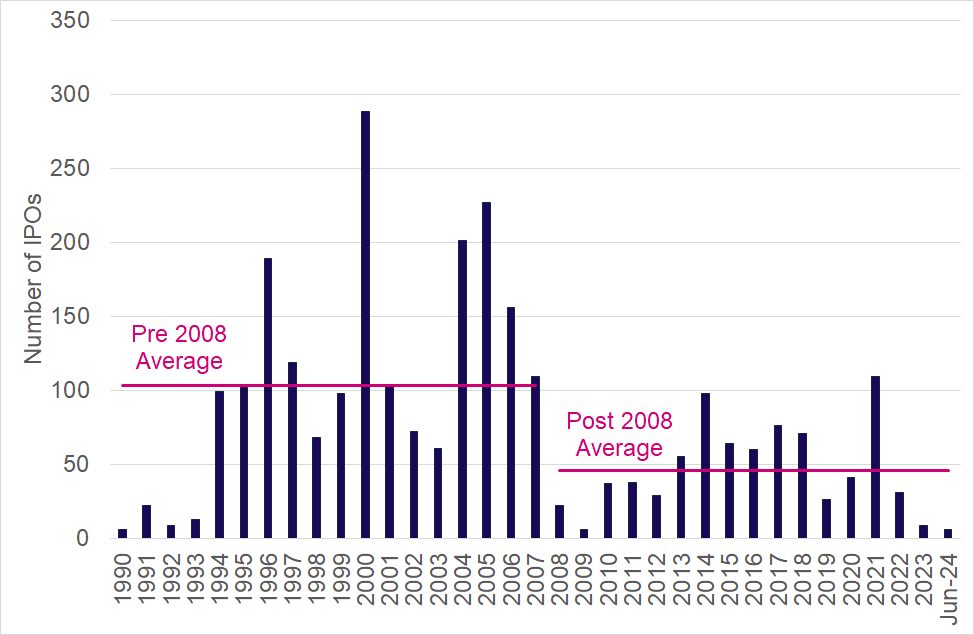
Like the US, the UK and France show distinctive IPO periods. Figure 15 shows that in the UK, there has been a substantial decline in the number of listings after 2008. The average number of IPOs fell by more than half from an average of 103 per year pre-2008, to an average of 46 post-2008.
Figure 15: Number of IPOs in the United Kingdom
Source: Bloomberg
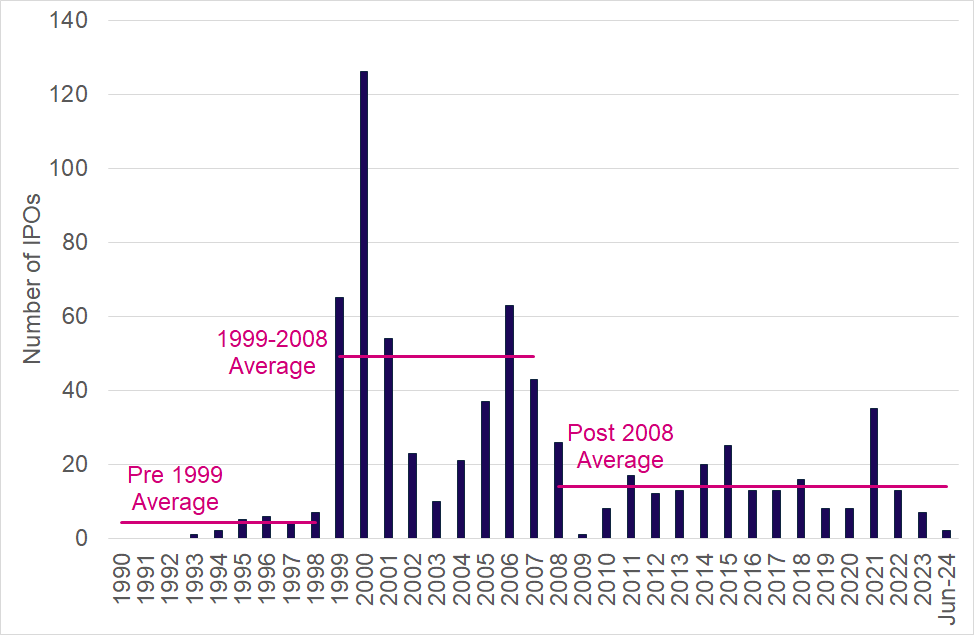
Figure 16 shows that France experienced a similar downward trend after the financial crisis, although the period prior to 1999 also had few IPOs. The average number of IPOs per year in France was four between 1990 to 1998, 47 between 1999 and 2008, and 13 after 2009. Like the US, the number of SEOs in the UK and France (Figure 13) do not exhibit a structural decline over the sample period. However, 2022, 2023, and the first half of 2024 also have fewer SEOs than the average over the prior decade.
Figure 16: Number of IPOs in France
Source: Bloomberg
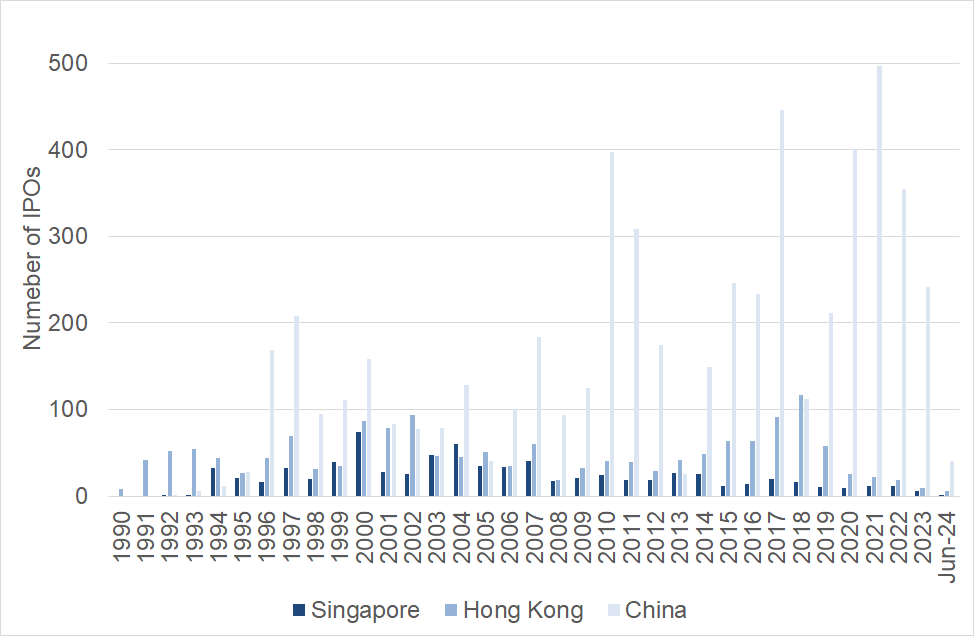
Figure 17 reports the number of IPOs in Singapore, Hong Kong and China over the period 1990 to June 2024. The trend of declining IPOs around 2000 and 2008 is not apparent in Asia. Singapore and Hong Kong do not exhibit a substantial trend in IPO activity over the period, with an average number of IPOs per year of 23 and 46, respectively. China shows substantial growth in the number of IPOs, with an average of 168 IPOs per year over the sample, peaking at close to 500 companies in 2021. There was a slowdown in the number of IPOs in China in 2022 and 2023, but they remain well above the historical average. However, as at June there have only been 41 IPOs in China in 2024.
Figure 17: Number of IPOs in Asia
Source: Bloomberg
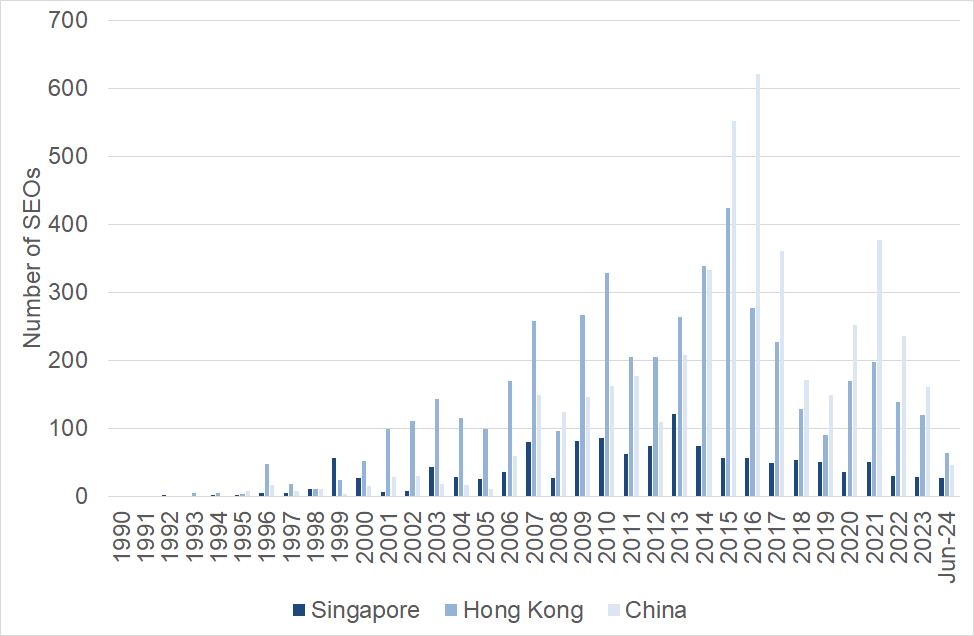
The number of SEOs in the regional markets is reported in Figure 18. This shows that there has been an upward trend in SEOs in all markets, but the speed of the growth is faster in Hong Kong and China than in Singapore. On average there were 40 SEOs in Singapore over the sample period, compared to an average of 146 for Hong Kong and 151 for China. SEOs in Singapore remained above the historical mean during the period 2022 to June 2024, while Hong Kong fell below its historical mean. Consistent with the pattern for IPOs, the number of SEOs in China remains above the historical mean for 2022 and 2023 but has fallen to only 46 SEOs for the six months to June 2024.
Figure 18: Number of SEOs in Asia
Source: Bloomberg
Appendix A reports additional statistics on the amounts of capital raised through IPOs and SEOs in each of these jurisdictions. In Europe and the US, the trends in the amount of capital raised in IPOs and SEOs differ substantially from the number of IPOs and SEOs. Canada shows similar trends in the capital raised as the US, although the magnitude of the capital raised is a smaller fraction of what is raised in the US (2% for IPOs and 8% for SEOs). Overall, there is an upward trend in the amount of capital raised through SEOs over the sample period for all countries. However, IPO capital raised has been flat in the UK, Singapore and Hong Kong, and declining in France. With the exception of 2021, in the period post the financial crisis, SEO capital has consistently exceeded IPO capital, in all countries except China. Both IPO and SEO capital raised were substantially reduced from 2022 to 2024 across all countries.
Overall takeaways: There have been very clear structural declines in the number of IPOs in the US, the UK and France. In the US this decline is not apparent when considering the amount of capital raised – which suggests the companies that have gone public have been larger. In France and the UK, the amount of capital raised has declined or been stagnant. All of these jurisdictions appear to have healthy markets for raising secondary capital with no decline in the number of SEOs or amounts of capital raised. Capital raising trends in Asia are different from the other markets considered, with declines only observed in the last 12 to 18 months.
3.2 Increasing market concentration
Global equity markets have become more concentrated since the financial crisis along three dimensions: country, sector and stock.
3.2.1 Concentration by country
The US market has become an increasingly important component of global equity markets. Strong equity market performance since the financial crisis has increased its share of global market capitalisation to 61%. This is higher than levels observed since the mid-2000s, but is substantially below the levels observed in the 1950s-1970s (Dimson, Marsh and Staunton, 2024). The share of equity market capitalisation relative to GDP has increased from lows of around 60% during the financial crisis to 170% in early 2024. The average market cap to GDP ratio for the rest of the world has remained stagnant at around 50% to 60% over the same period (Oppenheimer, Jaisson, Bell, von Scheele and Peytavin, 2024).
Foreign capital has shifted to the US market since the onset of COVID. Foreign holdings in US stocks have increased from USD 9 trillion in March 2020 to USD 16.7 trillion in June 2024. This represents an increase from 27% to 30% of US market capitalisation (Board of Governors of the Federal Reserve Board System, Rest of the World: International Portfolio Investment Holdings of Long-term Securities by Country, 20 December 2024.) This flow is likely due to the US market outperformance (Oppenheimer et al., 2024).
In addition to the capital flows, several large foreign companies, such as ARM, a British chip designer, and Birkenstock, a German shoe company, have chosen to list in the US rather than their home market.
3.2.2 Concentration by sector
The technology sector has become increasingly important in most global markets since the onset of COVID in 2020. This trend is particularly pronounced in the US where Technology, Media and Telecom account for approximately 35% of the S&P 500 index, however, it is also apparent in Asia. This concentration is due to the superior earnings growth of companies in the technology sector. The level of concentration in technology in the US is similar to the level of concentration in the Energy & Materials sectors in the US in the 1950s (Oppenheimer et al., 2024).
3.2.3 Concentration by stock
A great deal has been written in the financial press about the stock-level concentration in the US, with a focus on the Magnificent Seven (See for example Elder, What exactly is your problem with stock index concentration? Financial Times, 7 July 2023.; Nagle, The interlocking dimensions of stock market concentration, Financial Times, 12 March 2024; Wigglesworth, The US stock market has never been more concentrated. Does it matter? Financial Times, 7 January 2025). The largest 10 companies in the US account for more than 35% of the S&P 500 index, and just 26 stocks account for half the value of the S&P 500 index (Wigglesworth, The US stock market has never been more concentrated. Does it matter? Financial Times, 7 January 2025). This is higher than concentration levels observed in the US since the 1970s (Oppenheimer et al., 2024).
Despite the attention given to US stock-level concentration, the US is far from being the most concentrated market in the world. Numerous countries including Switzerland, France, Australia, Germany, the UK and Canada exhibit even higher concentration levels (Mauboussin and Callahan, 2024).
Should we be concerned about the increasing levels of concentration observed in the US, and the high levels of concentration observed in other markets? The industry appears divided on this question: some argue that investors should be concerned about high concentration because it is associated with lower long-run returns; while others argue that concentrated markets are not inherently risker and does not lead to future poor performance, but high valuation does. Therefore, questions about valuation are arguably more important. Goldman Sachs (2024) and Lamont (2024) provide more detailed discussions on these issues.
Bae, Bailey and Kang (2021) analyse whether market concentration is bad for the economy in a study of 47 countries from 1989 to 2016. They find that concentrated stock markets, dominated by a few firms, are associated with less efficient capital allocation, sluggish initial public offerings and innovation activity, and slower economic growth. However, the authors point out that there are no obvious policy solutions to address these results.
3.3 Growth in index investing
Rising stock market concentration makes it more challenging for active fund managers to outperform the market. When large companies outperform small companies, active managers are more likely to underperform their benchmarks. Standard and Poor’s S&P Indices Versus Active (SPIVA) report shows that the majority of active funds underperform their index benchmark. For example, 90% of US funds underperformed the S&P 1500 composite index in the 10 years to 2023. Similarly, 92% of European funds underperformed their benchmark over the same period.
Underperformance of active managers has fuelled growth in index investing. In the US, for the first time, the pool of index funds (USD 13.3 trillion) exceeds that of actively managed funds (USD 13.2 trillion) (Coggan, Passive funds leave actives languishing, Financial Times, 15 March 2024). This has in turn placed fee pressure on actively managed funds, as their underperformance is largely driven by higher fees relative to index products. In addition, it has encouraged active managers to pursue private market assets in a search for alpha. The growth in index investing means that for companies, index inclusion can have a substantial impact on investor interest and market liquidity. Companies not included in indices will likely find it more difficult to raise capital.
Overall takeaways: The outperformance of the US equity markets since the financial crisis has made it more difficult for other countries to compete for capital. Concentration at a sector- and stock-level has made it challenging for active managers to outperform the market in public markets.
4. Reasons for the decline of public equity markets
Public markets offer numerous valuable features for companies and investors. They enable companies to access capital, usually at a lower cost relative to other sources of capital. They provide price discovery through trading, where prices reflect the views of many investors in the market. This price discovery provides the company with “currency” that allows them to grow through acquisitions and to pay executives with stock-based remuneration. Public markets can also raise visibility for companies. For investors, public markets create abundant investment opportunities for unsophisticated investors. They also provide liquidity, allowing investors to exit investments as needed. Liquidity in turn helps to reduce the cost of capital.
However, being public also imposes costs on companies. The separation of ownership and management creates the potential for agency problems and information asymmetries. Therefore, to be public, companies must comply with disclosure and governance requirements as defined by the regulations in the jurisdiction in which they go public. These requirements impose both explicit and implicit costs on companies. The price discovery provided by the market may also introduce frictions as constant shareholder monitoring may encourage management to adopt a short-term focus in decision-making.
Declines in the number of companies going public suggest that there has been a shift in the benefits and costs of being public. Either the benefits have been reduced, or the costs have increased, or both. Such a shift could be because public markets have changed (e.g. disclosure obligations have increased) or because companies have changed (e.g. the nature of companies means that disclosure is more costly even if regulation is unchanged).
This section relies on the academic literature to explore the reasons for declining numbers of companies going public. Given that the decline in the number of public companies began in the US before anywhere else, it is not surprising that most of the academic literature focuses on this jurisdiction. There is a large body of literature exploring the decline of public markets, but it can be summarised around three key themes: (i) increased regulation and/or rising costs of being public; (ii) the changing nature of companies; and (iii) deregulation and easier access to private capital. The literature largely rules out (i) as being the main driver of declining public markets, and points to a combination of (ii) and (iii) explaining this trend. A recent paper from legal scholars suggests that focusing on the number of listed companies presents a distorted view, arguing that half the number of public companies generate more than double the profits and account for a larger share of GDP compared to pre-2000 (Roe and Wang, 2024). The following sections summarise the findings from this literature.
4.1 Increased regulation / rising cost of being public
Going public substantially changes the nature of ownership. All types of investors, both sophisticated and unsophisticated, can invest, and ownership becomes more dispersed. There is a greater risk of agency costs and information asymmetries between management and shareholders. Therefore, public companies are subject to rigorous disclosure and governance requirements to provide protections to shareholders, particularly minority shareholders and unsophisticated investors.
Disclosure and governance requirements are not a new feature of markets. However, some market commentators have observed that regulatory burdens on public companies have increased in the last twenty-five years, particularly in the US. The introduction of the Sarbanes Oxley Act in 2002 (SOX) is often cited as a reason for declining public companies. To a lesser extent, so too is the introduction of the Dodd-Frank Act in 2010. The Securities and Exchange Commission’s Regulation Fair Disclosure and the 2003 Global Settlement are also blamed for changing the IPO ecosystem, particularly for small companies. Together these regulatory changes have been labelled the regulatory over-reach hypothesis arguing that declining IPOs is due to excess regulation.
Some studies find support for this hypothesis. For example, Leuz (2007) and Leuz, Triantis and Wang (2008) show that SOX substantially increased the cost of being public. Engelen, Meoli, Signori and Vismara (2020) show that SOX-like regulations in Europe decreased the likelihood of small and high-tech firms going public. Dambra, Field and Gustafson (2015) shows that Jumpstart Our Business Startups (JOBS) Act 2012, which aimed to reduce the regulatory burden and costs of being public, increased IPO activity. However, other studies question these conclusions, suggesting regulation can only play a limited role in this decline. Notably Gao, Ritter and Zhul (2013) and Doidge et al. (2017) highlight that the decline in IPOs pre-dates SOX by multiple years. Caglio, Hanley, and Marietta-Westberg (2012) also show that relatively few US firms have chosen to go public abroad since the introduction of SOX which would be an avenue for companies to go public but avoid the additional costs associated with SOX. Further, foreign listings were not disproportionately affected, which would be expected if foreign companies avoided listing in the US due to costs (Doidge, Karolyi, and Stulz, 2009).
Perhaps the most compelling insight into the regulatory overreach hypothesis is in Ewens, Xiao and Xu (2024) who exploit regulatory changes that altered the thresholds at which companies had to comply with disclosure and governance obligations. This approach allows them to quantify the cost of being public and estimate the impact of these costs on going public and going private decisions. They find that the cost of being public explains only 7.3% of the decline in the likelihood of being listed after 2000. They also show that regulatory costs can not explain firms’ go-private decisions. They suggest this is likely because a large fraction of the costs of being public are irreversible sunk costs.
4.2 The changing nature of companies and economy
Several papers that have rejected the regulatory overreach hypothesis, have instead argued that the decline in IPOs is due to the changing nature of companies and the economy (Gao et al. (2013); Doidge et al. (2017). This includes suggestions that companies are harder to value, have more intangibles, need less capital and benefit more from mergers with large global firms than going public.
Kahle and Stulz (2017) document the evolution of US public companies over the period 1975 to 2015. They show that public companies are older. They are, on average, larger, and there are fewer small companies. They invest less in physical assets and more in Research and Development (R&D). They are less profitable, but because profits increase with size, the total profit for the market is higher. They have higher payout ratios. And institutional ownership has increased.
These changes have altered the need companies have for capital (Ewens and Farre-Mensa, 2022). Capital expenditures to assets have fallen from 10% over the period 1975 to 1996 to only 5.9% between 1997 and 2015. In contrast, R&D expenditure has increased from 3.4% to 6.1%. This has increased the importance of intangible assets. When these intangible assets are, as yet, unproven, they are difficult to value. The potential for agency problems is also higher. Therefore, raising money in private markets, where investors are more likely to have both technical and valuation expertise, is likely to be easier (Kahle and Stulz, 2017). It is also more attractive to founders because they will not have to risk disclosing information to potential competitors and can retain control.
Closely related to the importance of intangible assets is the economies of scope hypothesis [Note 17]. Intangible assets are more readily scalable than tangible assets. For example, when manufacturing a widget, increasing production requires increases in manufacturing capacity and therefore increased capital. In contrast, when selling a software product sales can be increased at low marginal cost (Doidge, Kahle, Karolyi and Stulz, 2018). Gao et al. (2013) argue that small firms can therefore generate more profits by being acquired by a firm in the same or related industry, rather than remaining independent and relying on organic growth. They present evidence in favour of this hypothesis and against the regulatory overreach hypothesis. Lattanzio, Megginson and Sanati (2023) also provide evidence that M&A activity is an important driver of the decline in US listings.
4.3 It is easier to raise private capital
If the rising cost of being public is not the main driver of declining listings, perhaps declining benefits of being public is the driver. Access to capital historically has been the main benefit of going public. This benefit has been diminished by the abundance of private capital that is now available. The term private capital is broad and includes both private equity and debt. Private equity includes leverage buy-outs, venture capital and secondaries. Private debt is the provision of credit by non-bank lenders on a bilateral basis. It can include lending anywhere in the capital stack. It also includes private investment in real economy assets such as real estate, infrastructure and natural resources.
This section documents the rise of private capital funds and offers explanations for their growth. The academic literature has focussed more on private equity than debt. As a result, this section has an emphasis on equity.
4.3.1 Growth in private capital assets under management
Estimates of the amount of private capital under management globally range from USD 13.1 trillion to USD 14.5 trillion. Differences are due to decisions about what assets to include or exclude from the estimate. McKinsey estimates AUM to be USD 13.1 trillion, while Bain & Co. estimate it to be USD 14.5 trillion [Note 18]. These estimates are for the period ending June 2023. Both firms use Preqin data for their estimates. McKinsey excludes secondaries, co-investment vehicles and direct lending, while Bain & Co. do not [Note 19]. McKinsey reports that private equity (including VC, growth and other) comprises USD 8.25 trillion. Ewens and Farre-Mensa (2022) report that the aggregated dollar amount raised in private financings in the US, since 2017, has exceeded the combined amount raised via IPOs and SEOs. While the pool of private capital assets is substantial, it remains modest in comparison to the USD 111 trillion in global public equity market capitalisation (Statista).
Figure 19 provides a breakdown of private capital by asset class and geography. The US accounts for 54% of all private capital AUM, and Europe and Asia make up around 20% each. For private equity (including VC, growth and other) these numbers are 53%, 17% and 27% for the US, Europe and Asia respectively. The US and Europe’s share of private equity exceeds their shares of public equity which are 45% and 14% respectively (Visual Capitalist).
Figure 19. Private markets assets under management, June 2023
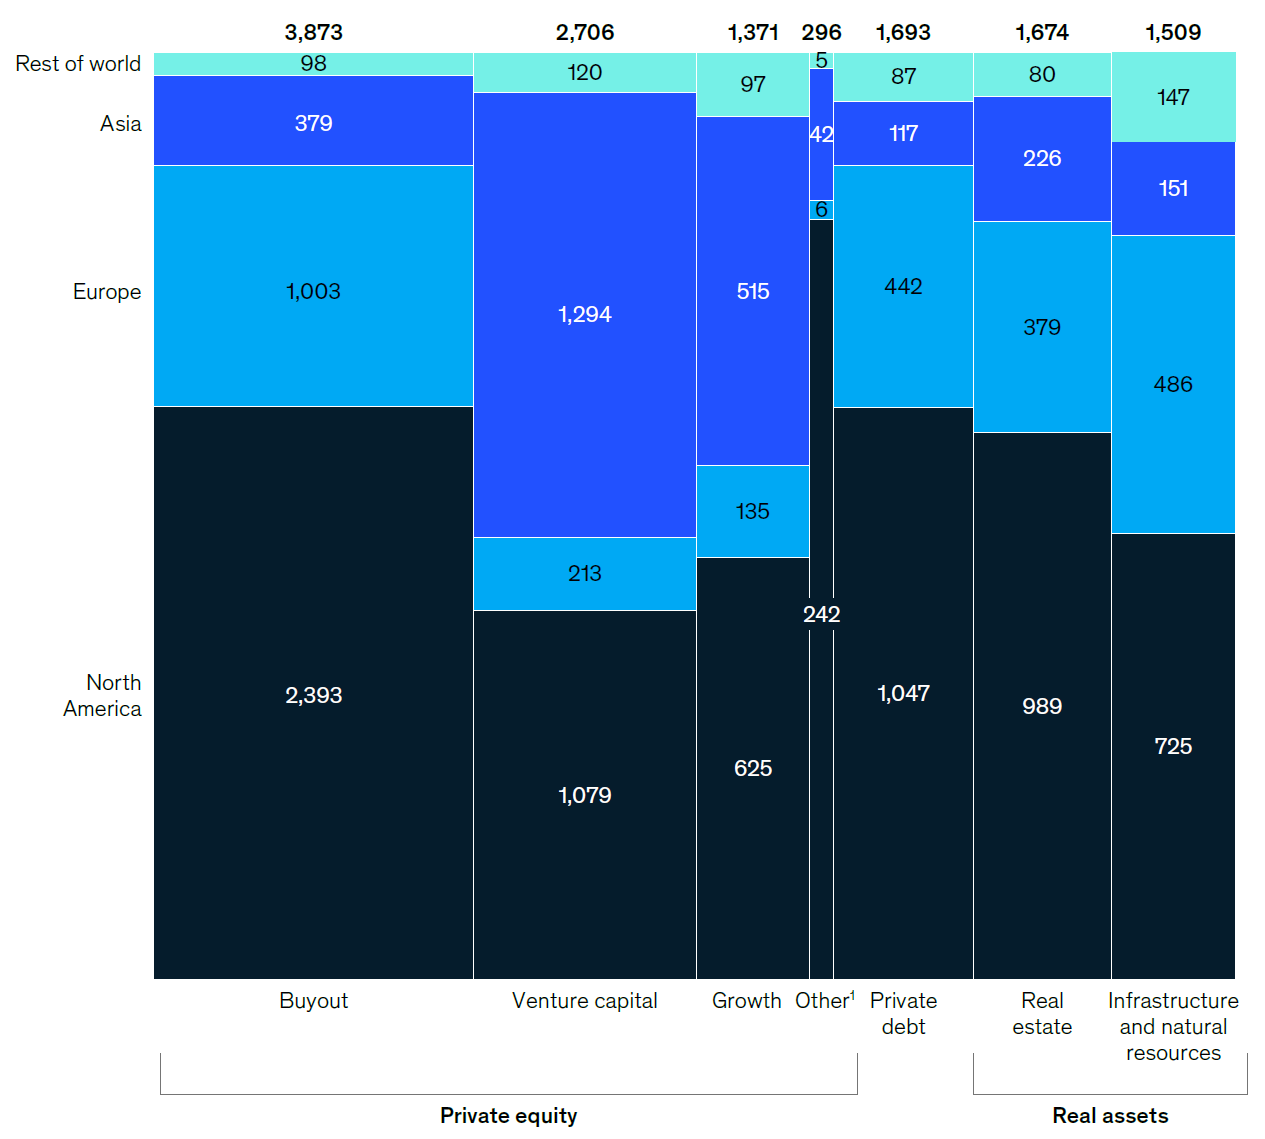
Source: McKinsey Global Private Markets Review 2024
Private market fundraising activity has grown substantially since 2009. Figure 20 shows that it grew by 440% from USD 278 billion in 2009 to USD 1.5 trillion in 2021. Like public equity markets, private market fundraising declined by 10.5% in 2022 and a further 22.4% in 2023. North America dominates the fundraising across the sample period. Europe has become increasingly more important relative to Asia. Private equity (including VC, growth and other) accounted for USD 649 billion or 62% of the private capital fundraising in 2023.
Figure 20: Private markets fund raising by region, 2007 to 2023
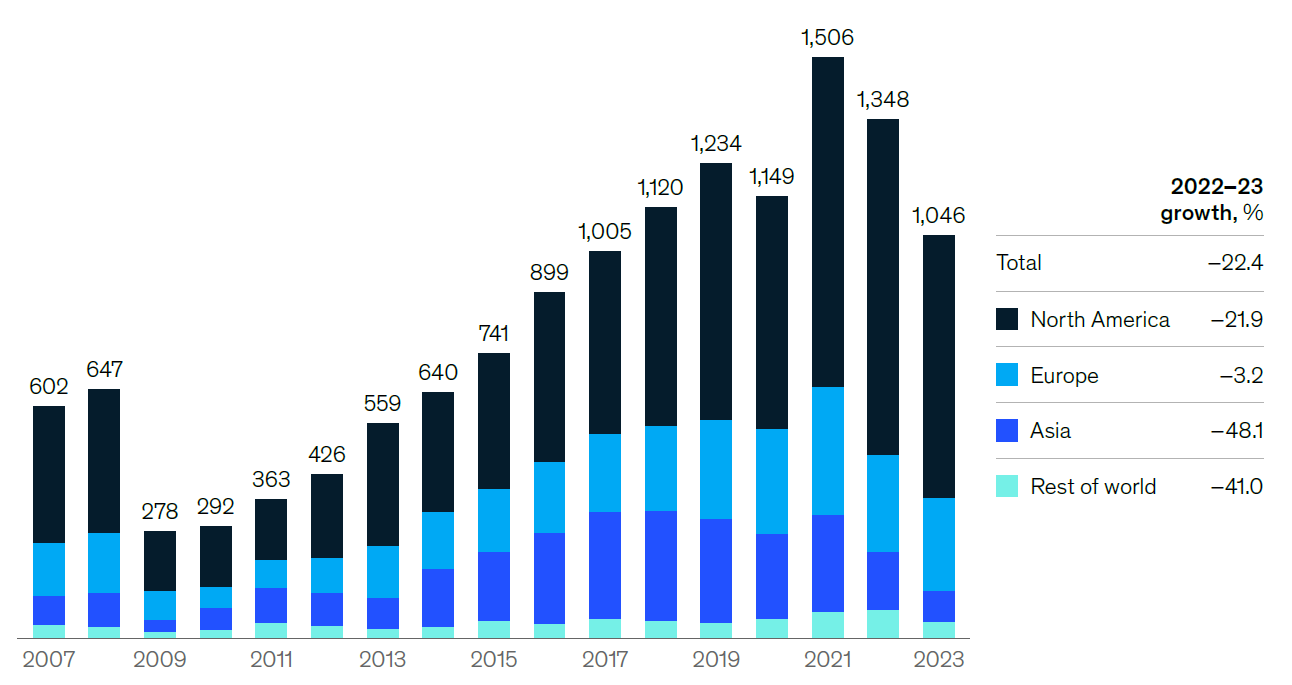
Source: McKinsey Global Private Markets Review 2024
4.3.2 Deregulation of private capital
De Fontenay (2017) hypothesises that the deregulation of US securities laws since the 1990s has facilitated private capital raising, making it less attractive for companies to go public. Perhaps the most important deregulatory event was the National Securities Markets Improvement Act (NSMIA) which took effect in October 1996. NSMIA made it easier for both private startups and the private capital funds investing in them to raise capital. It did this by exempting firms selling unregistered securities from disclosure requirements and increasing the number of investors that could invest in a fund before it needs to register and make disclosures.
The capital raising process for VC and PE funds was further facilitated by the Pension Protection Act of 2006. This Act made it easier for VC and PE funds to raise capital from public pension plans without triggering fiduciary rules. The JOBS Act 2012, also made it easier for private firms to raise capital by increasing the threshold for SEC reporting from 500 to 2000 record holders (Ewens and Farre-Mensa, 2022) [Note 20].
The most important of these changes, the NSMIA, were empirically examined by Ewens and Farre-Mensa (2020). They find that after the passage of the regulation, firms are more easily able to raise private capital, and that late-stage start-ups and capital-intensive startups benefited the most. These are precisely the firms that would historically have been candidates to go public.
To understand the capital raising trends for VC-backed startups, Ewens and Farre-Mensa (2020) consider the period 1992 to 2009 and examine start-ups that raised at least USD 150 million in the first seven years after their first round of funding. They show that for firms that received their first funding round before 1996, 83% went public at some point during the seven years. In contrast, for firms that received their first funding round after 1996, only 42% went public in the next seven years. These results show that after the introduction of the NSMIA, private markets supply large amounts of capital, enabling these firms to both access the needed capital and remain private.
Ewens and Farre-Mensa (2020) ask an important follow-up question: “Are these late-stage startups raising capital privately because they cannot go public—or is an IPO still an option for successful startups, but many choose to remain private instead?” A survey by Brau and Fawcett (2006) suggests that the main reason successful firms stay private is because the founders/managers want to maintain decision-making control and ownership. However, this conflicts with the desires of venture capital owners who want to go public to realise their investment returns. Ewens and Farre-Mensa find that founders who are able to retain a larger degree of control of their startup are less likely to eventually go public or be acquired.
In most jurisdictions, the regulation of private capital markets is much lighter than public markets. Other jurisdictions have also made changes to the ease with which firms can access private capital, however, academic studies assessing the impact of these changes have not been undertaken.
4.3.3 Founders retaining more control discourages going public
The increased supply of private capital and the decreasing capital requirements of start-ups early in their life-cycle have given founders greater bargaining power. Smaller initial funding rounds have meant that those that have been successful have been able to do so with less founder dilution. Ewens and Mensa (2022) show that the fraction of equity held by founders 12 months after the initial funding round increased from 50% to 55% in the 1990s to close to 70% by 2015. This gives founders more control over the decision about whether or not to go public. Although the research does not demonstrate a causal link it provides suggestive evidence that increasing founder ownership may contribute to the decline in IPOs.
4.3.4 Perception of better performance in private markets
It is commonly perceived that private markets outperform public markets. There is also a perception that private markets offer additional opportunities for investors to diversify their portfolios and reduce risk. Many private investors, particularly pension funds, have indicated plans to increase their private market allocations [Note 21]. Are these perceptions of outperformance and diversification supported by evidence?
Measuring private capital fund performance is difficult for multiple reasons. First, there are no requirements for funds to report performance publicly. Second, the long investment horizon for funds means that performance can only truly be measured after the fund has returned all funds to investors – which is typically an 8-to-12-year horizon. Third, the standard performance measure is an internal rate of return (IRR) which suffers from some flaws, most notably around assumptions about the re-investment rate [Note 22] and makes direct comparisons with public markets difficult.
Despite these challenges, there is a large body of academic literature that evaluates the performance of PE and VC funds. A comprehensive review of this literature is beyond the scope of this paper, but interested readers should consider Ljungqvist (2024) for more details.
The most well-regarded studies rely on private data sets such as Burgiss [Note 23] and Preqin [Note 24]. These businesses take different approaches to collecting data ranging from Freedom of Information Act requests, voluntary reporting and collection as a by-product of providing services to institutional investors. This means that coverage in each dataset may be different - leading to different performance outcomes. These studies have mostly focused on the US market. The typical approach in the literature is to compare the performance of PE funds to Kaplan and Schoar’s (2005) public market equivalent (PME). PME is the ratio of the fund’s net-of-fees distributions, discounted at the contemporaneous realized return on a suitable stock market index, and the fund’s drawdowns, discounted at the contemporaneous realized return on the same stock market index.
Historically the academic literature has shown that PE firms earn returns in excess of the S&P 500 index after fees. However, it is less clear whether this means private equity beats public equity in the sense of positive alpha. The abnormal returns may reflect additional risk, leverage or illiquidity. The PME approach does not attempt to control for these factors (Ljungqvist, 2024). There is also considerable debate about the most appropriate benchmark index for these analyses given that PE firms invest in much smaller companies than the typical S&P 500 stock.
More recent research suggests that US PE vintages after 2005/2006 have earned returns only equal to (Harris, Jenkinson, Kaplan, 2021) or less than public equities (Phalippou, 2020). Harris, Jenkinson and Kaplan (2021) report similar performance for European PE funds to what they find for US funds. They also find that VC performance has varied substantially over time, with funds from the 1990s substantially outperforming, those from the early 2000s underperforming and recent vintages showing improved performance. Given the large growth in private capital in recent years, competition for private assets is likely higher, which may potentially lead to lower expected returns in the future. In addition, assets purchased during the low interest rate environment will likely face lower valuations in the current, higher, interest rate environment. Only time will reveal how more recent vintages of private equity funds will perform.
Studies that have attempted to adjust for risk, size, liquidity and other factors have produced mixed results on whether or not private funds under- or out-perform [Note 25]. There is no consensus in the literature on the best approach to correctly make an assessment of these alternative investment options.
Overall, there is insufficient evidence to argue that private markets consistently outperform public markets. More nuanced analysis and better-quality data are required. Public reporting, or at least mandatory regulatory reporting, would provide the tools to undertake a thorough analysis of the performance of private vs public markets. Institutional investors in private capital funds should be demanding more information to support their decision-making.
4.3.5 Public funds investing in private markets
In recent years, traditional public market investors have increased their allocations to alternative asset classes. For example, the share of risky assets held by US public pension funds in alternatives like private equity, real estate and hedge funds has grown from 14% in 2001 to 39% in 2021 (Begenau, Liang and Siriwardane, 2024). Kwon, Lowry and Qian (2020) document increasing VC investments by mutual funds in the US, especially in later-stage companies. Aragon, Li and Lindsey (2023) show that hedge funds invest in private firms. Ivashina and Lerner (2018) report that global pension funds nearly doubled their allocation to private equity and real estate in the ten years to 2017, representing about 20% of assets under management or a USD 1.8 trillion shift to alternative assets. Ewens and Farre-Mensa (2022) show that university endowments increased their allocations to PE/VC from 5.5% in 2002 to 19.9% in 2019.
There is no single explanation for why public funds have begun investing in private markets. However, the academic literature offers some insights. First, it may be driven by perceived increases in the risk-adjusted returns relative to public equities. Second, with the growth in low-fee index products, private investments may help justify higher active fees (Ewens and Farre-Mensa, 2022). Third, private companies look increasingly like public companies in terms of size and age. Fourth, fewer public companies mean that actively managed equity funds and hedge funds have fewer public investment opportunities (Lowry, 2023). Finally, regulatory changes have enabled these investments (Ewens and Farre-Mensa, 2020). There is an element of circularity in the last three of these arguments: are public funds investing in private markets because companies are staying private longer, or are companies staying private longer because public market investors are willing to provide funding to private companies? This has not been resolved in the literature.
4.3.6 Private equity business as public companies
It is noteworthy that many of the largest private equity businesses in the world are public companies. The largest private equity firm, Blackstone went public in 2007, KKR in 2010, Apollo in 2011, Carlyle and Oaktree in 2012, EQT in 2019 and TPG in 2022 (Hinkley, The World’s Top 10 Publicly Traded Private Equity Firms, Growth Equity Interview Guide, 11 April 2023). Despite the weak IPO market globally, CVC Capital Partners went public in Amsterdam in April 2024, raising €2 billion in capital and experiencing a 24% increase in price on listing. Only €250 million of the raising was fresh capital for the company, with the remainder going to existing shareholders. The IPO valued CVC at €14 billion (Gopinath, Bloomberg, CVC Rises After €2 Billion IPO in Europe’s Best Debut in Years, 26 April 2024; Farr, Private equity group CVC shares soar on Amsterdam debut, Reuters, 26 April 2024). Like other businesses, an IPO provides private equity firms with an opportunity to raise capital to fund growth and allows founders to access liquidity and exit (some of) their holdings.
4.4 Are the number of listed companies and number of IPOs the right measure?
Roe and Wang (2024) challenge the conventional wisdom that a declining number of listed companies and the number of IPOs is indicative of the demise of public markets. They document that while the number of US-listed companies has fallen by half since 1996, the importance of public companies in the economy has not declined. They report that profits and stock market capitalisation have grown faster than the economy, while revenues and investment have kept up with the economy’s growth. Public company profits have doubled since 1996 and public company income accounts for 6% of US GDP, compared to less than 4% in 1996.
The authors argue that their evidence implies that the cost of regulation is not the cause of the decline in listings, because the companies that remain listed have become more profitable. They suggest their evidence favours arguments about changes in the nature of companies, which they dub Industrial Organisation Explanations.
Overall takeaways: The costs of being public appear to be only a minor contributor to the decline in public companies in the US. The relaxation of regulations for private companies and investors has shifted the trade-off companies face: companies can now stay private and still access large pools of capital. The changing nature of companies and their changing needs for capital have also altered the dynamics: with the desire to avoid disclosures rising as the importance of intangibles has grown. Further, consideration should be given to measures beyond the number of listed companies and IPOs when assessing the health of public markets.
5. Is Australia different?
The evidence presented in sections 2 and 3 shows that the state of the Australian public equity market is very different from that of the US and Europe. Evidence of declining numbers of public companies and IPOs is much more short-term. At the current time, this appears to be cyclical, but a more prolonged period of reduced IPOs and increased de-listings may indicate a structural change.
Are there also differences in the regulatory environment, nature of companies and private capital markets in Australia? The short answer is yes. This section explores these differences and the likely implications of these differences for the evolution of our public market.
5.1 Regulation and the cost of being public in Australia
Unlike the US, Australia has not had any substantial changes in the way in which public and private companies are regulated in the last two decades. And certainly, no substantial changes coincide with the decline in IPOs and increase in de-listings in 2022-2024. This section contrasts the regulatory framework for Australian public companies with public companies in the US, and private companies in Australia. It also quantifies the explicit costs of being listed in Australia.
5.1.1 Regulation of Australian public companies vs US public companies
Both public and private companies in Australia are governed by the Corporations Act. Publicly listed companies are also subject to ASX Listing Rules, arguably the most onerous component of which, is the Continuous Disclosure Rules. Listed companies must also abide by the ASX Corporate Governance Guidelines which were first introduced in March 2003, and are currently under review for a fifth edition later in 2024.
By world standards, the hurdles for being listed on the ASX are low. Companies must meet a Profit Test or an Asset Test. The Profit Test requires AUD 1 million of aggregated profit from continuing operations over the past 3 years and AUD 500,000 of consolidated profit from continuing operations over the last 12 months. The Asset Test requires AUD 4 million net tangible assets or AUD 15 million market capitalisation. In addition, companies must have a free float of at least 20%, and a shareholder spread with a minimum of 300 non-affiliated investors each investing at least AUD 2,000.
Financial reporting obligations for listed companies in Australia are less burdensome than in the US. Australian companies must report semi-annually compared to quarterly statements in the US. Reporting timeframes are also shorter in the US. US firms have continuous disclosure obligations to report significant transactions and new developments on a Form 8K. The ASX continuous disclosure obligations are extremely rigorous and require listed companies to report all material, price-sensitive information to the ASX immediately. Both countries require annual financial statements to be audited. The US also has onerous internal audit requirements. In Australia, companies must disclose if they have an internal audit process and how it works. If there is no internal audit function, the company must disclose its process for governance and risk management.
In the US, Sarbanes Oxley and the exchange listing rules impose substantial governance requirements on companies. For example, a majority independent board is mandated, as are fully independent audit, compensation and nominating committees. Nasdaq requires two diverse board members and annual disclosure of diversity statistics [Note 26]. In contrast, the ASX Corporate Governance Guidelines operate on an “if not, why not” basis. This means companies have discretion about their governance practices, but that they must provide a statement explaining why they deviate from the best practice guidelines. This is particularly useful for small companies, who may find it costly to adhere to all of the guidelines.
While the guidelines allow some flexibility, some market commentators argue that the cost of compliance is high and that it distracts management and board from focusing on more strategic issues. Concerns have also been expressed about excessive requirements related to diversity, climate risks and cyber-security [Note 27]. However, 75% of ASX 200 companies are reported to have voluntarily committed to adopting or have already adopted the Task Force on Climate-related Financial Disclosures (TCFD) framework (Australian Council of Superannuation Investors, Promises, Pathways & Performance: Climate Change Disclosures in the ASX 200, August 2023). Voluntary compliance with these and other disclosures suggests companies see value in providing additional information to the market.
Lowry (2023) reports that private company boards begin to resemble public company boards as companies become larger. This may be due to plans to become public in the future, or due to more dispersed owners wanting larger and more independent boards to enhance monitoring. In a study of VC-backed start-ups, Ewens and Malenko (2022) provide evidence of board composition and director characteristics changing over the life of a start-up with independent directors playing both a mediating and advising role over the life cycle. They argue this is a source of value-add to startup performance. There is a large academic literature on the value of “good” corporate governance for companies, which means consideration should be given not just to the costs of a rigorous governance framework but also the benefits of additional monitoring for strategic decision making [Note 28]. This is very difficult to quantify.
5.1.2 Regulation of Australian public companies vs Australian private companies
In comparison to public companies, the regulatory burden for large proprietary companies in Australia is low. Large proprietary companies are only required to lodge financial statements and a director's report once a year. The accounts must be audited, unless ASIC grants relief. A company is considered to be large if it satisfies at least two of the following criteria: (i) the consolidated revenue for the financial year of the company and any entities it controls is $25 million or more; (ii) the value of the consolidated gross assets at the end of the financial year of the company and any entities it controls is $12.5 million or more; and (iii) the company and any entities it controls have 50 or more employees at the end of the financial year [Note 29]. The reporting obligations of large private companies, therefore, are substantially lower than those of publicly listed companies.
The government has recently passed legislation that requires both public and private companies to disclose information about climate-related risks and opportunities [Note 30]. The requirements will be rolled-out in three phases, commencing in July 2025, with large companies that meet two of the following criteria: consolidated revenue over AUD 500 million; gross assets over AUD 1 billion and more than 500 employees. The disclosure requirements will also be applied to asset owners such as superannuation funds and registered schemes with AUM exceeding AUD 5 billion at a later date. Smaller companies will be required to comply by July 2026 and July 2027. This approach of applying disclosure requirements based on size rather than public company status levels the playing field between the public and private markets.
5.1.3 Explicit costs of going public in Australia and the US
Commentators often argue that the explicit costs of being listed are a disincentive to going public. TDM Growth Partners, a Sydney-based investment services firm, estimates the initial cost of listing in the US is approximately two times higher than in Australia, at USD 14.3 million vs USD 6.45 million. This includes underwriting, legal, accounting and other offer expenses and initial listing fees. They estimate the ongoing listing costs to be USD 2 million and USD 1.05 million for the US and Australia, respectively (TDM Growth Partners, IPO Considerations, June 2023 ).
The Australasian Investor Relations Association (AIRA) recently reported estimated costs of being listed by company size based on a survey of its listed company members (AIRA Media Release, 7 September 2023 ). They reported the median cost for ASX300-listed companies is AUD 7.3 million. Based on the median market capitalisation of ASX300 stocks as at 30 June 2024, this represents around 0.33% of the market capitalisation of the median company in the ASX300. AIRA also report the breakdown of the costs, which includes: 39% for people costs, 21% for directors and officers’ insurance, 24% for audit and assurance, 5% for registry and 2% for exchange fees. Median costs for ASX50 companies are AUD 8.8m, for ASX50-100 companies AUD 9.8m, ASX100-200 companies AUD 6.6 million and ASX200+ listed companies AUD 4.4 million. Based on the median capitalisation for ASX50 stocks this cost falls to 0.045% of market capitalisation. These costs compare extremely favourably against the 4.3% of market capitalisation costs estimated for the US by Ewens, Xiao and Xu (2024). However, it should be noted that the cost estimation approaches are extremely different across the two markets.
Overall takeaways: The evidence suggests that the regulatory burden and explicit costs of being public in Australia are much lower than for public companies in the US. It is therefore not likely to be the primary driver of companies staying private. However, more research needs to be done to evaluate the costs and benefits of the disclosure and governance requirements imposed on Australian public companies. If there are specific pain points for listed companies consideration should be given to these concerns. Further, adopting disclosure and governance requirements based on size and significance to the economy may level the playing field between public and private markets.
5.2 Nature of listed companies in Australia
Given the relatively low listing hurdle, it is unsurprising that the average size of companies listed on the ASX is relatively small. Approximately 82% (65%) of listed companies have market capitalisation of less than AUD 500 million (100 million) as at December 30, 2023. Only 14% of companies have a market cap exceeding AUD 1 billion.
Figure 21: ASX listed companies by size
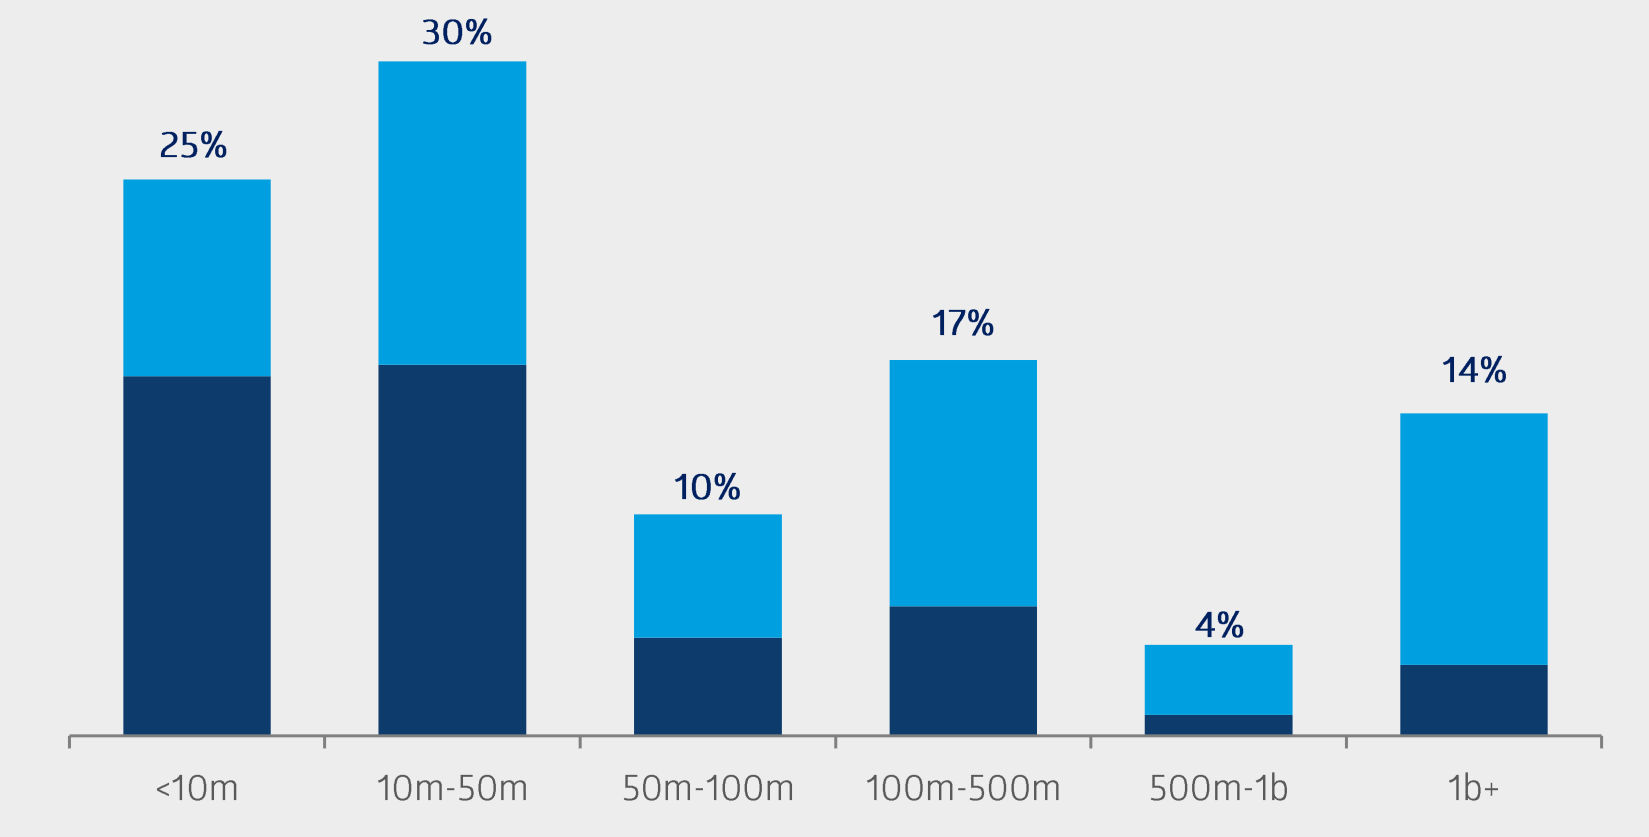
Source: ASX, Capital with confidence presentation, H2, 2024
Marsh and Gilbey (2023) report that over the last two decades, 78% of listings were companies with market capitalisations of less than AUD 75m. They argue that the Australian IPO eco-system is akin to the US VC/PE eco-system. They state that ASX IPOs account for 91% of all Australian early-stage equity capital, compared to 22% of their counterparts in the USA. In its marketing materials, ASX states that is “optimised for early-stage growth companies” (ASX Limited, Capital with confidence: A launch pad to accelerate your growth, H2, 2024, Investor Presentation). These differences perhaps help to explain why ASX listings have not declined in the same manner as the US and Europe.
Marsh and Gilbey (2023) argue that standardised listing rules and flexibility in governance requirements have helped support the capital raising eco-system. Companies must meet buy-side compliance and due-diligence requirements but they also “get on the radar screen” of institutional investors, and can gain entry to indices at a much smaller size. They argue that the possibility of offering preferred and partially paid or contributing (“hybrid”) securities allows investors to create payoff structures similar to the US VC market but in the context of a public market.
The Australian market is extremely concentrated. Figure 22 shows that at the end of 2024 the largest 10 (20) companies listed on the ASX accounted for 40% (53%) of total market capitalisation. As discussed in section 3.2.2 this is high by world standards. However, concentration is lower than it was at the end of 2014 when it was 45% and 57% for the top 10 and 20 companies, respectively, but higher than the lows of 34% and 46% observed in 2021.
Figure 22: ASX market concentration by stock size
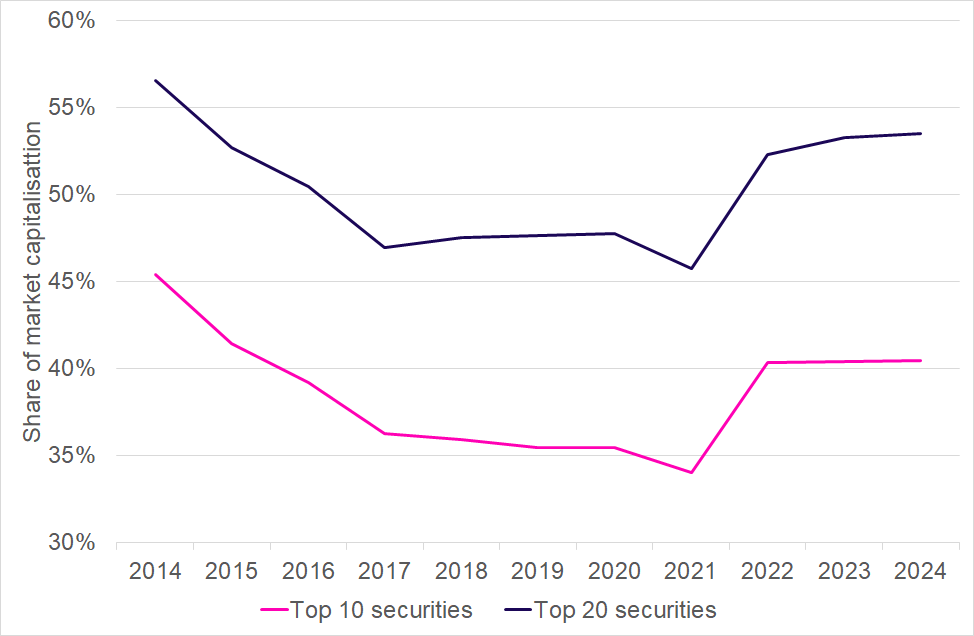
Source: ASIC Equity Market Data
The ASX has always been characterised by high levels of industry concentration. The financial and materials sectors are dominant industries in the Australian economy. Figure 23 shows that at the end of December 2024, the Financials sector accounted for 30.3% of ASX market capitalisation and the Materials sector accounted for 18.7%. Financials account for a smaller share of the market than they did in 2014, although Real Estate was disaggregated from Financials in 2016. However, if these sectors are re-aggregated in 2024 they account for 36.8% compared to 43% in 2014. Materials have become more important rising from 14.5% to 18.7%. Although relatively small, the Information Technology sector has shown the largest relative growth in share of market capitalisation, more than doubling from 1.4% to 4.2%.
Overall industry concentration is typically measured using the Herfindahl-Hirschman Index (HHI) [Note 31]. Using this measure, ASX industry concentration over the period December 2016 to December 2024 has declined slightly from 1,706to 1,617 [Note 32].
Figure 23: ASX industry concentration
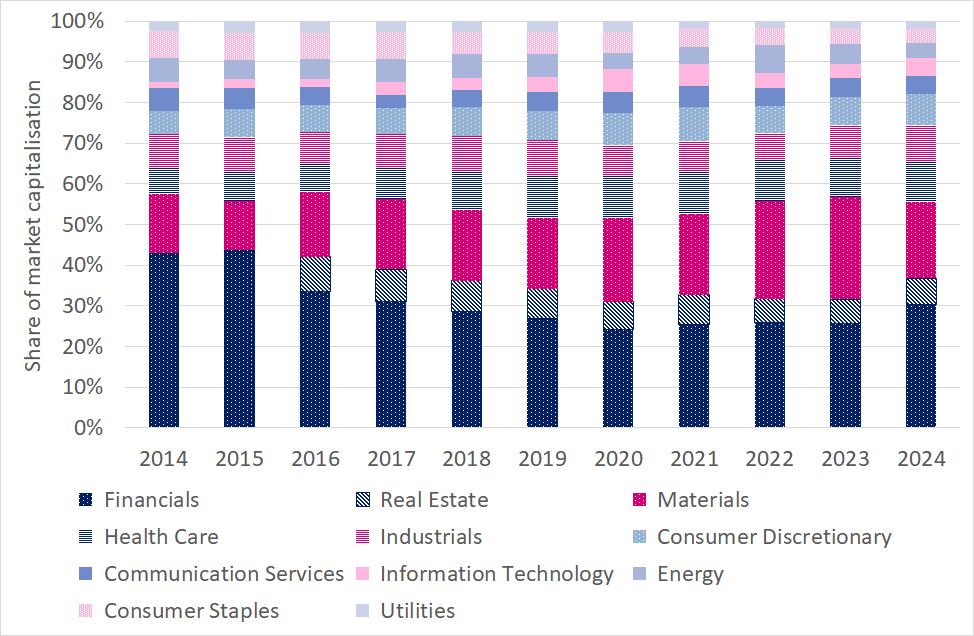
Source: ASIC Equity Market Data
Marsh and Gilbey (2023), who study a longer time series from 1999 to 2022, also show software/tech companies have become more important in the last 20 years accounting for 312 IPOs and AUD 26.4 billion in capital raised. They show that the average period from incorporation to listing for these tech companies is 5.5 years, which is considerably longer than the 3 years mining companies, but much faster than banks and insurance companies at 17 and 21 years, respectively.
5.3 Private capital assets under management and capital raising in Australia
Despite the ASX accounting for the bulk of early-stage capital raised in Australia, private capital has been growing quickly. Figure 24 [Note 33] shows that the assets under management in Australia-focussed private capital funds have grown by more than 350% over the period 2010 to June 2023, rising from AUD 29.8 billion in 2010 to AUD 139 billion in June 2023. This growth is in part due to significant accumulation of dry powder, which stands at AUD 43.6 billion in June 2023.
Figure 24: Australia-focused private capital AUM
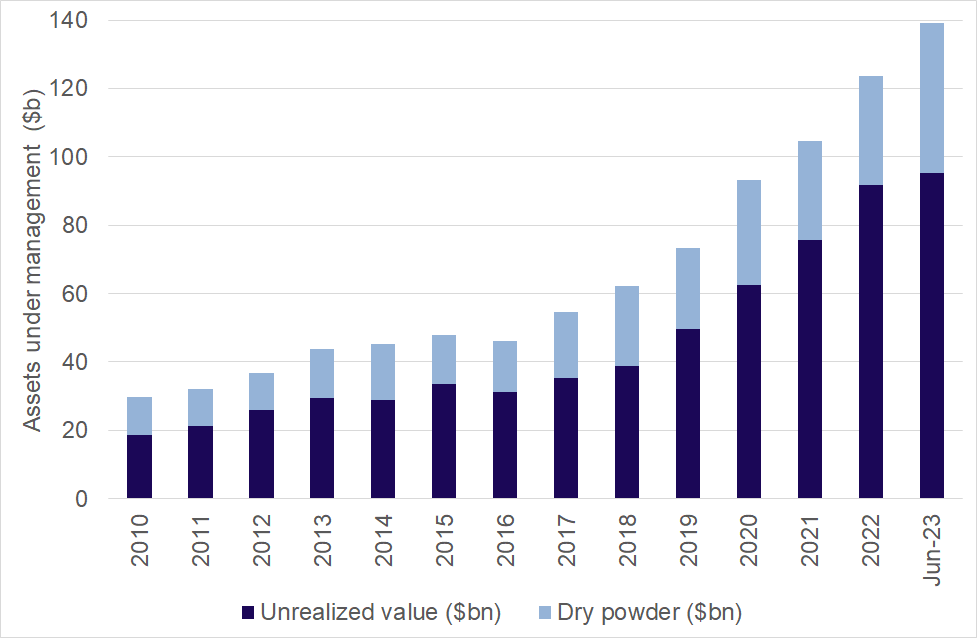
Source: Preqin and AIC Yearbook 2024
Figure 25 illustrates that private equity (PE) has historically been the largest private asset class, growing from AUD 21 billion in 2010 to AUD 45.5 billion in June 2023. However, since 2021 private real estate assets have exceeded PE assets, standing at AUD 55.7 billion in June 2023. Infrastructure assets have grown the most quickly, rising 46 times from AUD 0.2 billion in 2014 to AUD 9.4 billion in June 2023.
Despite the impressive growth over the last decade private capital assets under management remain very small relative to the size and scale of the public equity markets, where market capitalisation has grown from AUD 1.4 trillion to AUD 2.5 trillion over the same period. Private equity and venture capital are less than 2.5% of the public equity market capitalisation. Australian private capital accounts for only 0.7% (0.52%) of global private capital (equity) as at June 2023, compared to 1.6% of world public equity markets as at December 2023.
Figure 25: Australia-focused private capital AUM by asset class
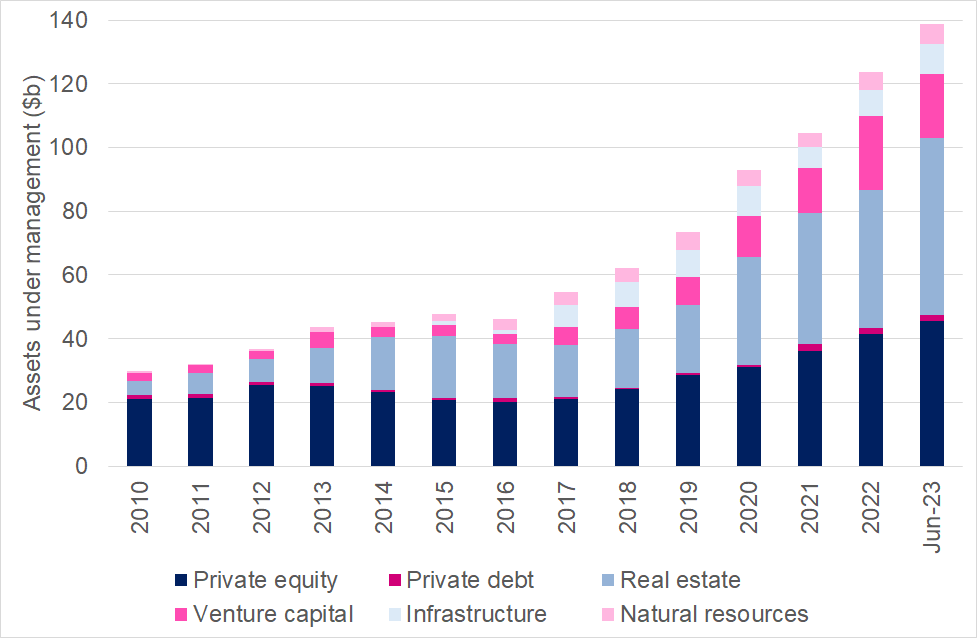
Source: Preqin and AIC Yearbook 2024
Although private capital asset managers hold substantial dry powder, they have been successful at continuing to raise new money. For example, Figure 26 shows that between 2010 and June 2023 there were 162 new funds who collectively raised AUD 43b. This compares to a total of AUD 500 billion raised in public equity markets over the same period, of which AUD 84 billion was through IPOs. Like in public markets, the amount of funds raised by PE managers fell in 2022 and June 2023. Over this period there were 26 new funds launched, raising AUD 12 billion. This represents only a fraction raised in public equity markets over the same period (AUD 45 billion), but substantially exceeds the AUD 1.3 billion raised through IPOs over this period [Note 34].
Harris and Chow (2024) report that the share of capital committed to Australian private equity funds from foreign investors rose from 10% in 2010 to 45% in 2019. The authors speculate that most of this capital has come from North America. Over the same period, they report that superannuation funds have become a smaller share of this market, falling from around 60% to 30%.
Figure 26: Australia-focused private equity fund raising
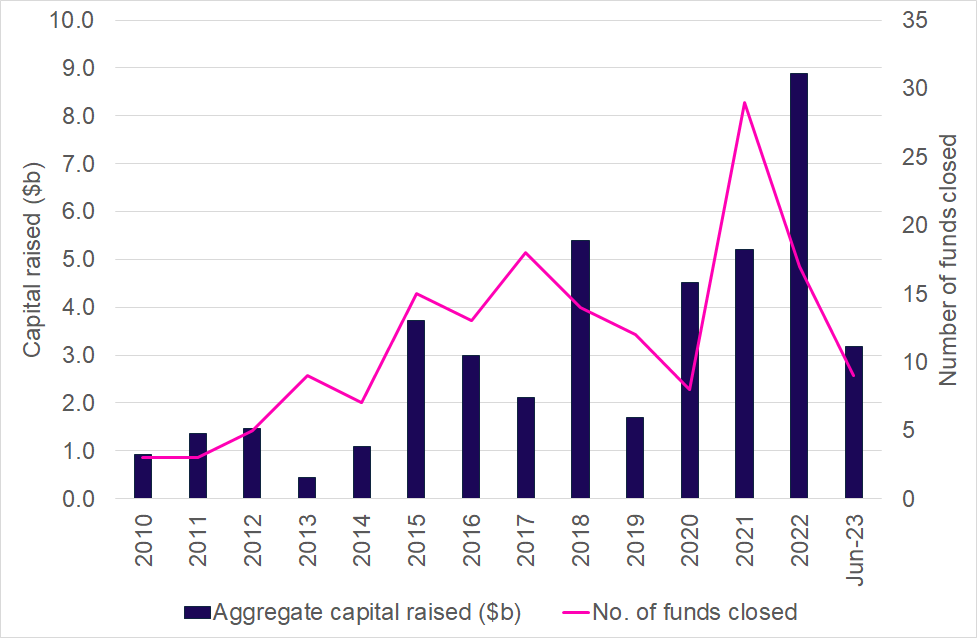
Source: Preqin and AIC Yearbook 2024
The value and number of PE buy-out and venture capital (VC) deals are displayed in Figure 27. Despite rising interest rates, PE deal value peaked at AUD 64.4 billion in 2022. The value of VC deals fell from AUD 8.7 billion in 2021 to AUD 6 billion in 2022. Deal value fell dramatically in 2023 to for AUD 13.2 billion for PE and AUD 3.8 billion for VC.
The Australian Investment Council do not provide any data on exits. However, a recent Australian Financial Review article suggests that Australian private equity firms are holding on to assets longer, waiting for better market conditions to exit positions, at least partially due to a subdued IPO market (Weinman, Private equity hunts for $66b in exits, Australian Financial Review, 12 July 2024.). The article reports that dozens of companies have had the same private equity investors for six or seven years, longer than the typical horizon for PE investments, and that there is a significant valuation gap between public and private market expectations.
Figure 27: Australia-focussed PE and VC deal value and number
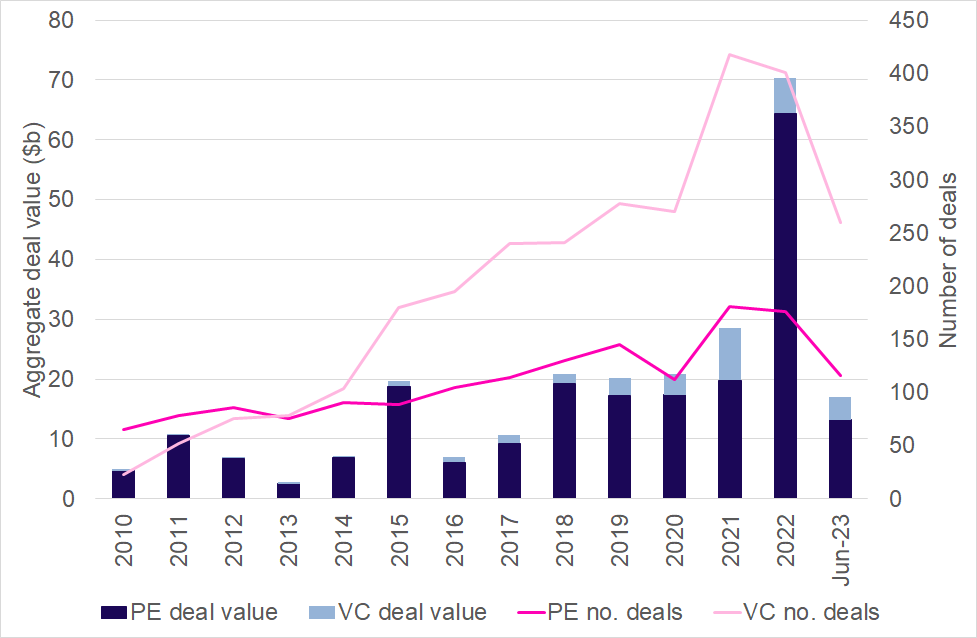
Source: Preqin and AIC Yearbook 2024
There are no academic studies on the performance of the Australian PE and VC sectors due to the absence of public performance data. Cambridge Associates produces quarterly statistics for the Australian Investment Council which are published on the Council website. These statistics show that PE/VC firms in Australia have outperformed the public market equivalent return over three, five, 10 and 20-year horizons. The ASX300 and the Small Ordinaries indices are the public market equivalent benchmark. It is noteworthy that Cambridge relies on voluntary reporting of fund performance data and excludes funds from their analysis when a fund stops reporting to them. This means that these statistics will suffer from a survivorship bias as underperforming funds are more likely to stop reporting.
5.4 Size of the Australian superannuation sector
The superannuation sector is a dominant force in Australian financial markets. Superannuation assets under management stood at AUD 4.08 trillion in September 2024, including AUD 2.83 trillion in APRA-regulated funds and just over AUD 1 trillion in Self-Managed Super Funds (APRA Quarterly Superannuation Performance Statistics, September 2024).
APRA-regulated funds and Self-Managed Super (SMSF) holdings account for a substantial and growing fraction of ASX market capitalisation. Figure 28 shows that the pool of superannuation assets invested in the ASX rose from 28.2% of its market capitalisation in June 2022 to 34.8% in September 2024. The share of ASX market capitalisation held by APRA-regulated funds grew faster, from 17.5% to 23%, compared to 10.7% to 11.8% for SMSFs. The APRA-regulated fund estimates are based on the aggregate asset allocations to Australian listed equities, property and infrastructure reported in the APRA Quarterly Fund Level Statistics, and the SMSF estimates are based on the aggregate asset allocations reported to Listed Trusted and Listed Shares in the Australian Tax Office Self-Managed Fund Quarterly Statistical Report.
Figure 28: APRA-regulated fund and SMSF share of ASX market capitalisation
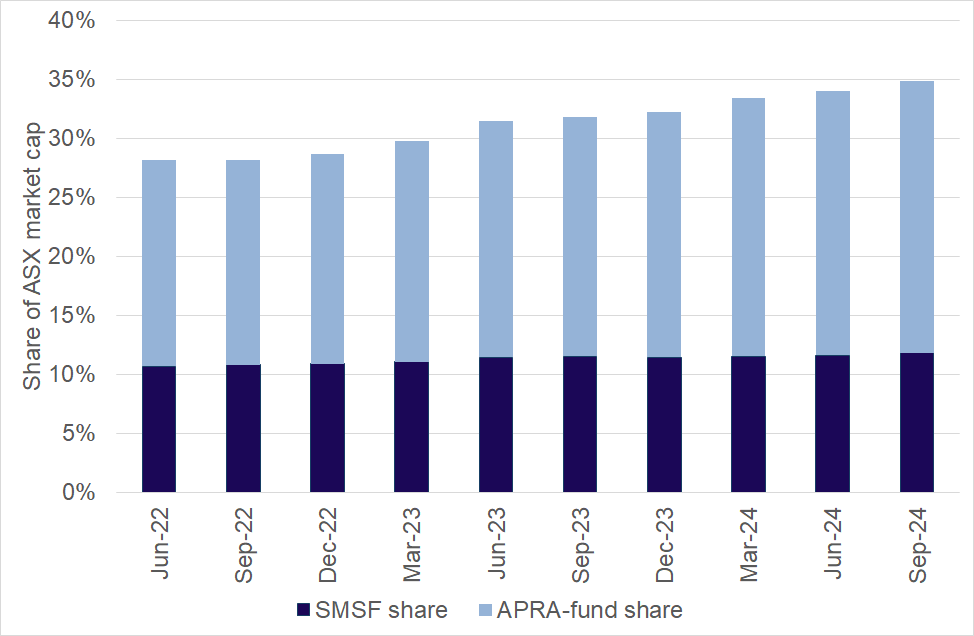
Source: Author's calculations based on APRA, ATO, ASIC data
Deloitte Actuaries and Consultants (2024) predict the AUM held by super funds will grow to AUD 11.2 trillion over the next 20 years. Deloitte states that this estimate assumes that super contributions will rise to 12% of wages by 2025, but they do not provide details of other assumptions made to arrive at this estimate. If super funds continue to invest the same proportion of their portfolio in ASX equities, and the ASX market capitalisation does not grow at an equivalent rate, the share of ASX market capitalisation held in superannuation portfolios will continue to grow.
There has been substantial consolidation in the super sector, with the largest five (ten) funds managing 44.5% (63%) of total fund investments (APRA Quarterly Fund Level Statistics, September 2024). The size of this sector, and more specifically, the size of the largest funds relative to the size of the ASX market capitalisation, means that managing investment size and trading costs in domestic equities becomes more challenging. This challenge is likely to have contributed to changes in super fund asset allocations over the decade.
Figure 29 shows changes in the fraction of total investments allocated to Australian listed equities and international listed equities by APRA-regulated super funds over the period September 2013 to September 2024. Two different time series are reported in this figure, labelled series 1 (S1) and series 2 (S2) because APRA’s Superannuation Data Transformation process has changed the reporting framework for superannuation funds (For details see APRA’s Superannuation Data Transformation, March 2024). On average super funds increased the fraction of total investments in international listed equities from 16.8% to 29.9% over the period. The allocation to Australian listed equities fell from a high in March 2014 of 24.9% to a low of 18.7% in March 2020. This allocation began rising again in June 2022, ending approximately where it began at 24.2% in September 2024. Changes in allocations are a function of both decisions made by the funds and changes in asset values.
Figure 29: Super fund investment allocation to domestic and international equities
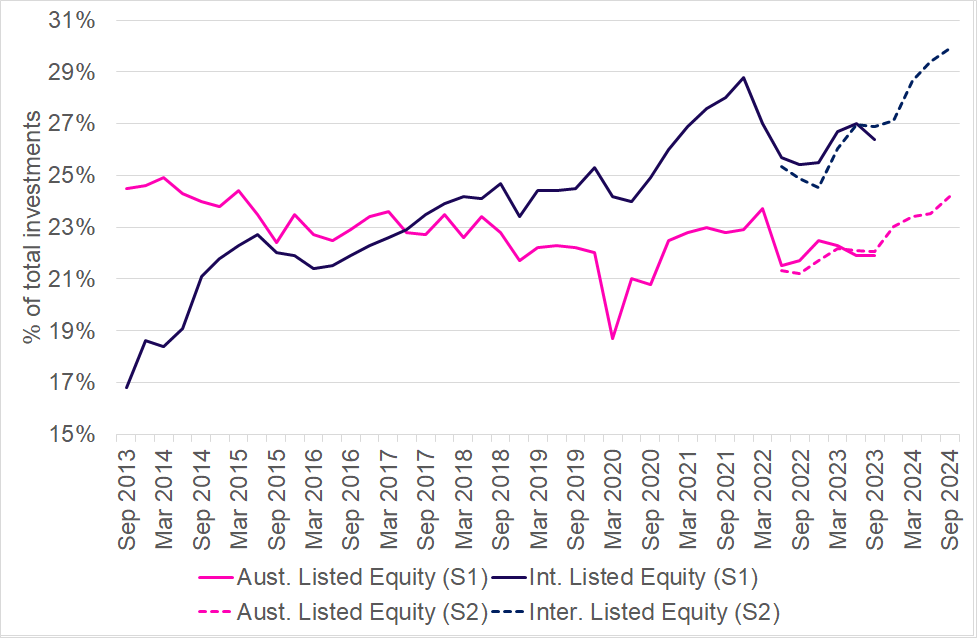
Source: Author’s calculations based on APRA statistics, September 2024
Like other global pension funds, super funds are also increasing their allocations to private assets including equity, credit, infrastructure and property. For example, AustralianSuper and Australian Retirement Trust (ART), Australia’s two largest super funds have nearly a quarter of their assets invested in private markets. Figure 30 shows the breakdown of their private investments by asset class, taken from the fund financial statements. The AustralianSuper Annual Report provides the fair value in an inactive or unquoted market held directly and indirectly by them. The ART Annual Report provides the fair value of level 3 assets held directly and indirectly by them. AustralianSuper has nearly 12% of its portfolio in private Australian and international infrastructure assets. ART has just under 10% of its portfolio in private infrastructure assets. AustralianSuper (ART) has 4.5% (6.1%) invested in private equity. For AustralianSuper over 80% of these assets are in international markets, compared to just over half for ART.
Hostplus is reported to have the highest allocations to private assets at 51% [Note 35]. AustralianSuper has publicly stated that it intends to increase its private equity allocation to 9% over the next four years. It also relocated the global head of private equity to New York and said it planned to double its existing team of nine private equity experts. It also plans to triple its private credit allocation by 2030 (Bainbridge and Henderson, AustralianSuper Plans to Double Private Equity Assets in Four Years, Bloomberg, 11 April 2024). Other super funds have also signalled plans to expand their private asset allocations (Pension & Investments, Australian super fund Rest makes private equity push, 24 May 2024).
Figure 30: Allocations for private assets for Australian Super and Australian Retirement Trust
| Australian Super: Total Investment ($millions) | Australian Super: % Total Assets | Australian Retirement Trust: Total Investment ($millions) | Australian Retirement Trust: % Total Assets | |
| Aus Infrastructure | 21,631 | 6.0% | 18,018 | 5.8% |
| Int Infrastructure | 21,242 | 5.9% | 12,528 | 4.0% |
| Aus private credit | 1,019 | 0.3% | 65 | 0.0% |
| Int private credit | 5,187 | 1.4% | 4,065 | 1.3% |
| Aus private equity | 2,897 | 0.8% | 8,837 | 2.8% |
| Int private equity | 13,137 | 3.6% | 9,949 | 3.2% |
| Aus property | 7,430 | 2.1% | 7,102 | 2.3% |
| Int property | 4,855 | 1.3% | 7,847 | 2.5% |
| Other | 280 | 0.1% | 49 | 0.0% |
| Total private assets | 77,678 | 21.6% | 68,460 | 22.1% |
Source: Australian Super and Australian Retirement Trust Financial Statements, 2024
Given their size, some of the super fund private asset acquisitions have included large “take-private” transactions. One of the most high-profile examples was a consortium of funds, which included Australian Retirement Trust, AustralianSuper, and UniSuper, which acquired Sydney Airport at an enterprise value of AUD 32 billion (Djurdjevic, Sydney Aviation Alliance completes acquisition of Sydney Airport, Investor Daily, 10 March 2022). Other examples included Commonwealth Superannuation Corporation being part of a Brookfield-led consortium to acquire Uniti Group for AUD 3.4 billion and AustralianSuper in collaboration with BGH Capital to acquire Navitas for AUD 2.3 billion (Baird, Uniti signs $3.6b deal with Morrison-Brookfield group, Australian Financial Review, 14 April 2022; Bolton, BGH looks overseas after $2.3 billion deal for Navitas, Australian Financial Review, 21 March 2019). It is even rumoured that a group of super funds seriously considered a takeover bid for the ASX in late 2023 (Thompson, Sood and Rapaport, Cabal of industry super funds, led by investors, weighed ASX takeover, Australian Financial Review, 9 May 2024). International PE firms have also been involved in several “take-private” transactions including a KKR-led acquisition of Spark Infrastructure for AUD 5.2 billion, Blackstone acquired Crown Resorts for AUD 8.9 billion, and Bain acquired Estia Health for AUD 838 million (Ellichipuram, KKR and partners complete acquisition of Spark Infrastructure, Power Technology, 23 December 2021; Blackstone, Blackstone completes acquisition of Crown Resorts in the firm’s largest investment to date in Asia, 24 June 2022; Evans, Bain wins over Estia in $838m victory for private equity, Australian Financial Review, 7 August 2023).
6. Other relevant developments
7. Risks of a shift to private
Public markets have been shown to improve capital allocation in the economy (Wurgler, 2000) and have been linked to economic growth and capital accumulation (Levine and Zervos, 1999; Levine, 2005). They also affect the real economy through the informational role of stock prices (Bond, Edmans and Goldstein, 2012). They also provide retail investors with potential exposure to corporate profits (Ljungqvist, Persson and Tag, 2018). Are these benefits at risk, if too much capital shifts from public to private markets? This section explores some of the academic literature assessing the risks of the shift to private capital.
8. Conclusions
Overall, this paper does not find evidence to support the claims that the Australian public market is in structural decline. However, there is reason to carefully watch the developments in both the private and public markets and to dig further into the reasons for the recent trends that have been observed in Australia.
The trade-offs that companies face in deciding to go public appear to have altered as private capital has become more readily available. Historically to gain access to capital, companies had to be willing to disclose more information to the market and comply with a higher governance burden. Today, it is easier for companies to gain access to private capital without having to make those trade-offs.
The higher interest rate environment increases the cost of capital for companies and reduces asset valuations. The impact this will have on the performance of more recent private capital fund vintages that made investments during the low interest rate environment is, as yet, unclear. Only time will tell.
Notes
Note 1. See Gluyas and Thomson, The ASX is shrinking for the first time in 18 years, Australian Financial Review, 5 June 2023; Weinman, Private equity risks leaving ASX behind, RBA warns, Australian Financial Review, 18 April 2024, Chanticleer, Shrinking ASX looking worse this year, despite appetite for equity deals, Australian Financial Review, 10 April 2024. [return to content]
Note 2. See Hughes and Steer, Global supply of equities shrinks at fastest pace in decades, Financial Times, 5 April 2024; Asgari, Smith, Wilson and Douglas, Why European stock markets are in crisis, Financial Times, 3 March 2024. [return to content]
Note 3. Data are sourced from Morningstar DatAnalysis. Morningstar offers a longer time-series for listings, however, de-listings are not recorded until 1990. [return to content]
Note 4. The ASX website reports the number of listed entities on a monthly basis from 2010 to 2024. The numbers reported in the Morningstar data are slightly lower than those reported by ASX. The ASX website only provides its company directory on a static basis, therefore it is not possible to reconcile differences across the data sources over time. However, an analysis of the ASX company directory and historical market statistics shows that ASX numbers are higher because they count each individual entity in a stapled group, while Morningstar count these entities once. The trends in the number of listed entities are consistent across the two data sources. [return to content]
Note 5. Data are sourced from Morningstar DatAnalysis. This data source does not contain any de-listings prior to 1989. Morningstar contains 256 companies for which they do report a listing date. This analysis assumes they were listed before 1990. [return to content]
Note 6. ASX publishes on its website the listing rule which lead to the de-listing for companies de-listed in the last 6 months. However, this information is not sufficiently granular to fully understand the reason for de-listing. For example, in the last six months, 57 of the 74 companies de-listed were de-listed due to Listing Rule 17.11, which is a de-listing at the request of the company. However, this could be for a range of reasons including an acquisition or illiquidity. [return to content]
Note 7. Data are sourced from Bloomberg. Note that over the sample period Bloomberg reports only 2,897 IPOs compared to 3,369 new listings reported in Morningstar DatAnalysis. Part of the reason for the lower values is that Bloomberg does not include capital raisings by all entity types. Further, the Primary Exchange data are missing from some observations in the Bloomberg data. It is therefore possible that stocks from the National Stock Exchange are included. Where these companies have been identified they are removed from the sample. [return to content]
Note 8. Data are sourced from Morningstar DatAnalysis. The 256 companies that are missing listing dates are excluded from this analysis. [return to content]
Note 9. Note that for companies listed after 2008, insufficient time has elapsed for the companies to have survived 15 years. When the category for companies listed in 2000s is restricted to exclude companies listed in 2009 the number of companies that survived 15 years rises marginally from 51% to 53%. Similarly, when companies listed after 2013 are excluded from the 2010 estimates, the number of companies that survive more than 10 years rises from 28% to 59%. [return to content]
Note 10. Data are sourced from Bloomberg. [return to content]
Note 11. Neither the Morningstar DatAnalysis nor Bloomberg data reconcile with the aggregate data reported on the ASX website. The ASX website data cannot be disaggregated, therefore this report relies on Morningstar DatAnalysis and Bloomberg as its primary sources. [return to content]
Note 12. See ASIC Equity Market Data for details of the data and how the market aggregate statistics are calculated. [return to content]
Note 13. The bid ask spread is the difference between the best ask price minus the best bid price across the ASX and Cboe Australia order books divided by the midpoint price. It is sampled every minute during the trading day. Quoted spreads are value-weighted across stocks to provide a market aggregate value. [return to content]
Note 14. The quoted depth is the total dollar value of orders available at the best bid and best ask price across the ASX and Cboe Australia order books. It is sampled every minute during the trading day. Depths are value-weighted across stocks to provide a market aggregate value. [return to content]
Note 15. Data are sourced from Bloomberg. [return to content]
Note 16. Data are sourced from Bloomberg. The sample includes IPOs and SEOs where the listing exchange is the Canadian Securities Exchange, Toronto Stock Exchange and the Toronto Venture Exchange. [return to content]
Note 17. Economies of scope occur when a company can produce multiple products more cost-effectively together than separately. This advantage arises from sharing resources, technology, or processes across different products. [return to content]
Note 18. McKinsey estimates are sourced from the McKinsey Global Private Markets Review 2024 and Bain & Co estimates are sourced from Bain & Co Global Private Equity Report 2024. [return to content]
Note 19. EY report an even larger estimate of USD 24.4 trillion, however, their estimates include hedge funds and family offices which may hold public as well as private assets. See Burke, Walsh and Coe, Are you harnessing the growth and resilience of private capital?, Ernst & Young, 4 April 2024 for further details. [return to content]
Note 20. See de Fontenay (2017) and Ewens and Farre-Mensa (2020,2022) for further about these regulatory changes. [return to content]
Note 21. See for example a post by the American Investment Council, a lobby group for the PE industry, for details of these arguments. [return to content]
Note 22. See Phalippou (2020) for a detailed discussion of how assumptions about being able to reinvest funds at the same rate can lead to overestimates of the IRR when initially cash flows reflect unusually high returns. He argues strongly in favour of using net of fee Multiples of Money to evaluate PE performance rather than IRRs. [return to content]
Note 23. Burgiss was acquired by MSCI in 2023. [return to content]
Note 24. In July 2024, BlackRock announced it would acquire Preqin, which is yet to complete as it is subject to regulatory approvals. [return to content]
Note 25. See for example Driessen, Lin, and Phalippou (2012), Ewens, Jones, and Rhodes-Kropf (2013), Gupta and van Nieuwerburgh (2021), Boyer et al. (2023). [return to content]
Note 26. In December 2024, the United States Court of Appeals for the Fifth Circuit vacated the US Securities and Exchange Commission's approval of Nasdaq's board diversity rules. See Raymond, US appeals court tosses Nasdaq board diversity rules, Reuters, 13 December 2024 for details. [return to content]
Note 27. See for example Burshstein, Red tape driving shift from public markets to private equity, Australian Financial Review, 6 June 2024, Durkin and Patten, ASX warned its race, sexuality push on boards is misguided, Australian Financial Review, 3 June 2024, Media Release - 2023 AIRA Releases White Paper on ESG Reporting Transition. [return to content]
Note 28. See Coles, Naveen and Naveen (2022) for a review of the academic literature on the monitoring and advisory role of boards. [return to content]
Note 29. Companies below these thresholds are not required to lodge financial statements with ASIC, and are only required to provide financial statements to shareholders on request. [return to content]
Note 30. The new legislation is the Treasury Laws Amendment (Financial Market Infrastructure and Other Measures) Bill 2024. It included two separate policy initiatives: to strengthen regulatory arrangements for Australia’s financial market infrastructure and to impose mandatory climate-related disclosure obligations on large businesses. [return to content]
Note 31. The HHI measures is calculated by summing the squared market share percentages of each industry's capitalisation. [return to content]
Note 32. It is not possible to compare the HHI in 2014 to 2024 due to the disaggregation of the Financials and Real Estate sectors in the data from 2016. If Financials and Real Estate are reaggregated after 2016 the HHI falls from 2,326 in 2014 to 2,011 in 2024. [return to content]
Note 33. Private capital data are sourced from the Preqin and Australian Investment Council Yearbook 2004. [return to content]
Note 34. Figure 38 in Appendix B shows the equivalent statistics for total private capital. This shows that there was more than AUD 110.6 billion raised by 837 new funds between 2010 and 2023. In the 18 months to June 2023 there was AUD 28 billion raised by 113 new funds. [return to content]
Note 35. This is reported to be in its MySuper product. See Wootton, Hostplus tops super sector for illiquid asset exposure, Australian Financial Review, 4 July 2023 for details. [return to content]
Note 36. Nadauld, Sensoy, Vorkink and Weisbach (2019) outline reasons for these sales which include active portfolio management and cash flow pressures, particularly when LPs receive funding calls from GPs. [return to content]
Note 37. See Mason and Utke (2023) for further details about private equity secondary markets. [return to content]
Note 38. For example KKR-backed healthcare company BrightSpring dropped 15% on its first day of trading on the Nasdaq (Or and Lipschultz, KKR-Backed BrightSpring Sinks 15% in Debut After IPO Flop, Bloomberg, 26 January 2024). [return to content]
Note 39. Their sample includes US-based companies that went through a Leveraged Buy-Out sponsored by a private equity firm and had to file with the SEC. [return to content]
Note 40. It is noteworthy that the authors state that the fees charged to portfolio companies are not specified in Limited Partner Agreements (LPA) but are contracted upon in Management Services Agreements (MSAs) which are signed by GPs and representatives of the company at the time of the transaction after the LPA is reached. Therefore, LPs are making investment decisions without having visibility on these costs. [return to content]
Appendix A. Additional information about capital raising in other regions
Figure 31 shows the amount of capital raised in IPOs and SEOs in the US. These results differ substantially from the number of IPOs. Overall, there is an upward trend in the amount of capital raised through both IPOs and SEOs over the sample period. With the exception of 2021, in the period post the financial crisis, SEO capital has consistently exceeded IPO capital. Both IPO and SEO capital raised are substantially reduced from 2022 to 2024.
Figure 31: Capital raised in IPOs and SEOs in the US
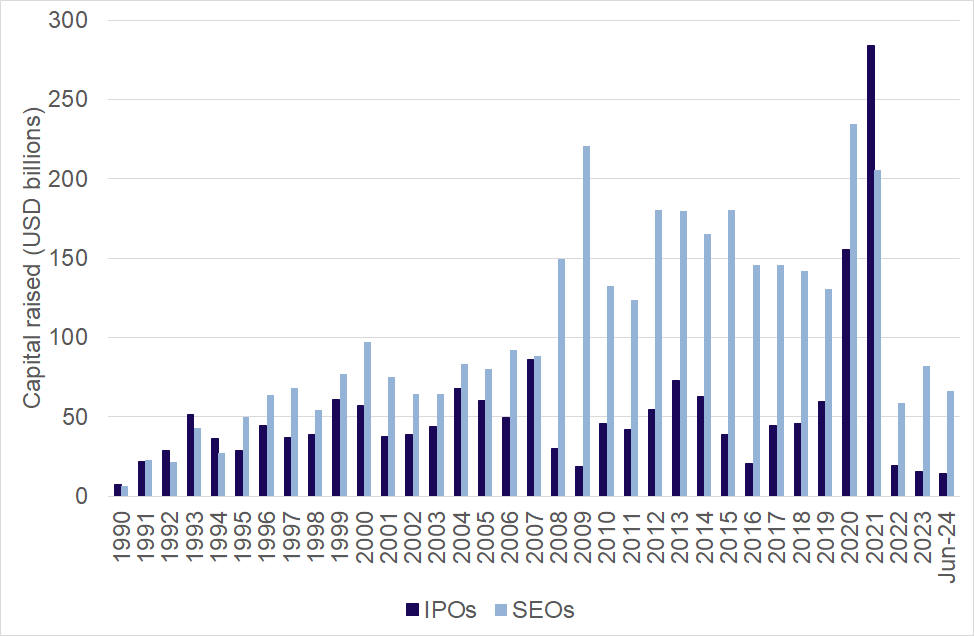
Source: Bloomberg
Figure 32 reports the amount of capital raised through both IPOs and SEOs in Canada. Like in the US, the amount of SEO capital raised consistently exceeds IPO capital.
Figure 32: Capital raised in IPOs and SEOs in Canada
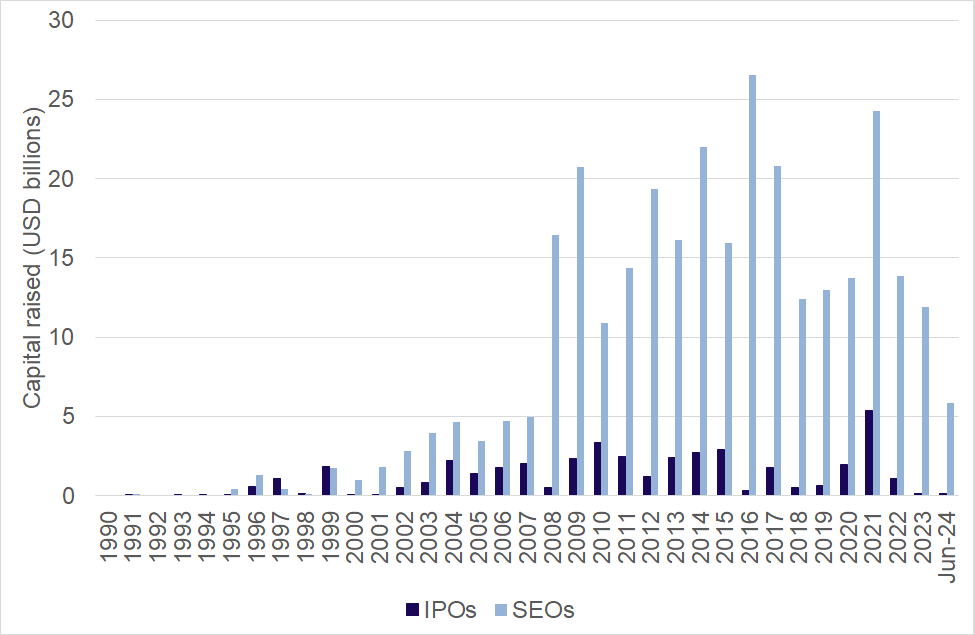
Source: Bloomberg
Figure 33 and Figure 34 report the amount of capital raised through both IPOs and SEOs in the UK and France respectively. Like in the US, the dollar amounts raised exhibit different patterns to the number of IPOs and SEOs. In the UK, IPO capital amounts have been stagnant over the whole period, but SEOs have trended up. Total capital raised through SEOs is more than 2.5 times that raised through IPOs. In France, IPO capital raised has trended down, while SEOs have trended up. However, overall SEOs raised more than 3.3 times the capital raised through IPOs. Like the US, SEO capital raised in the period 2022 to June 2024 is well below the average capital raised in year in the decade prior. IPO amounts have been dismal for both the UK and France over the period 2022 to June 2024.
Figure 33: Capital raised in IPOs and SEOs in the UK
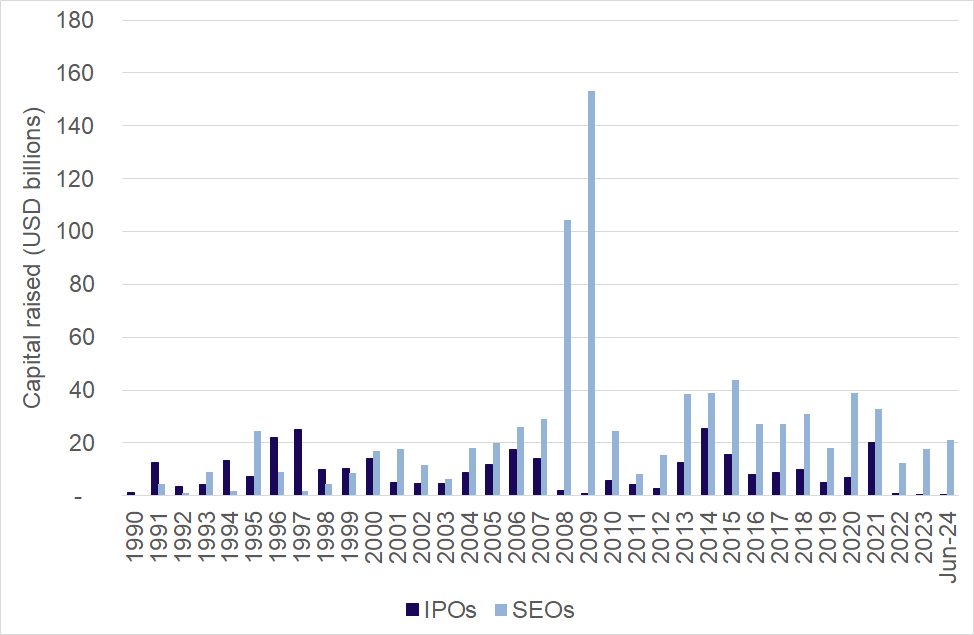
Source: Bloomberg
Figure 34: Capital raised in IPOs and SEOs in France
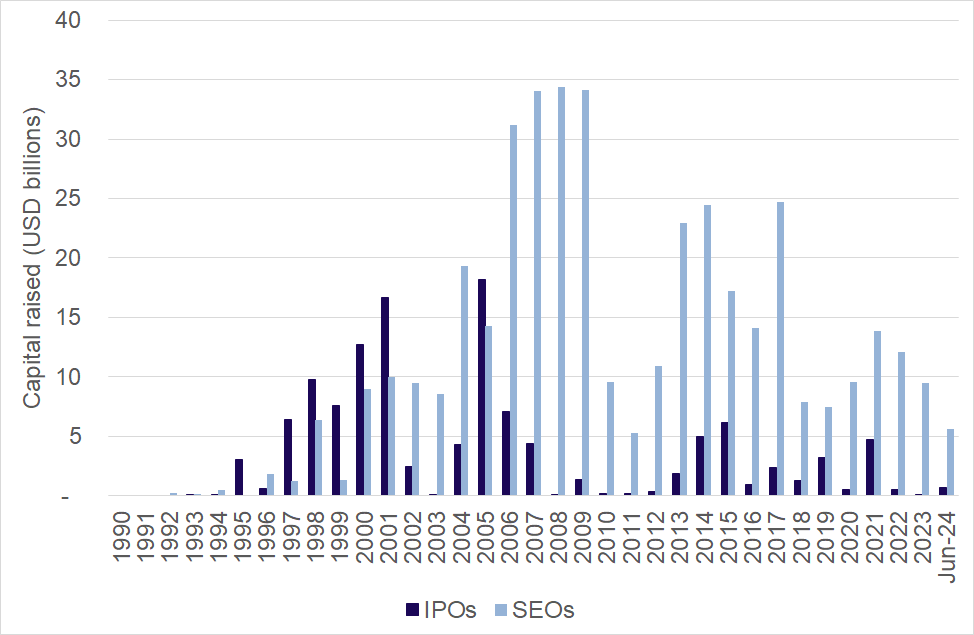
Source: Bloomberg
Figure 35, Figure 36 and Figure 37 report the amount of capital raised in IPOs and SEOs in Singapore, Hong Kong and China, respectively. In both Singapore and Hong Kong, the amount of capital raised through IPOs varied over the period but showed no clear trend. Capital raised through SEOs trended up in Singapore and Hong Kong but has been subdued since 2022. Overall, the amount raised in SEOs was approximately double that of IPOs in both Singapore and Hong Kong.
In China, both IPO and SEO capital raised trended up over the whole sample period but was more subdued in 2023 and 2024. Over the whole sample period SEO capital raised only about 20% more than IPO capital, however in the period 2012 through 2018 SEO capital raising dominated, with only USD 155 billion raised through IPOs, compared to USD 608 billion through SEOs.
Figure 35: Capital raised in IPOs and SEOs in Singapore
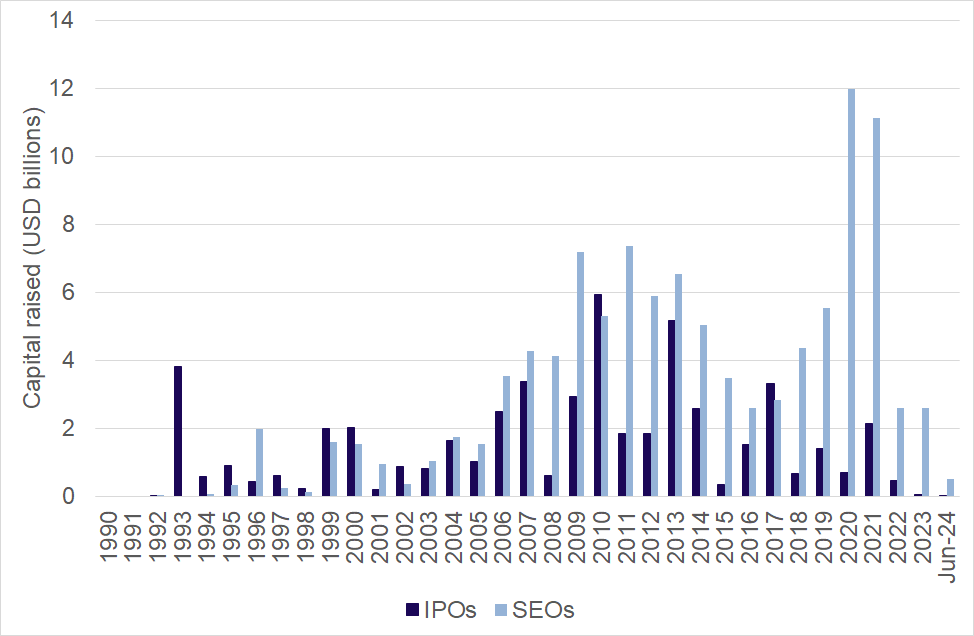
Source: Bloomberg
Figure 36: Capital raised in IPOs and SEOs in Hong Kong
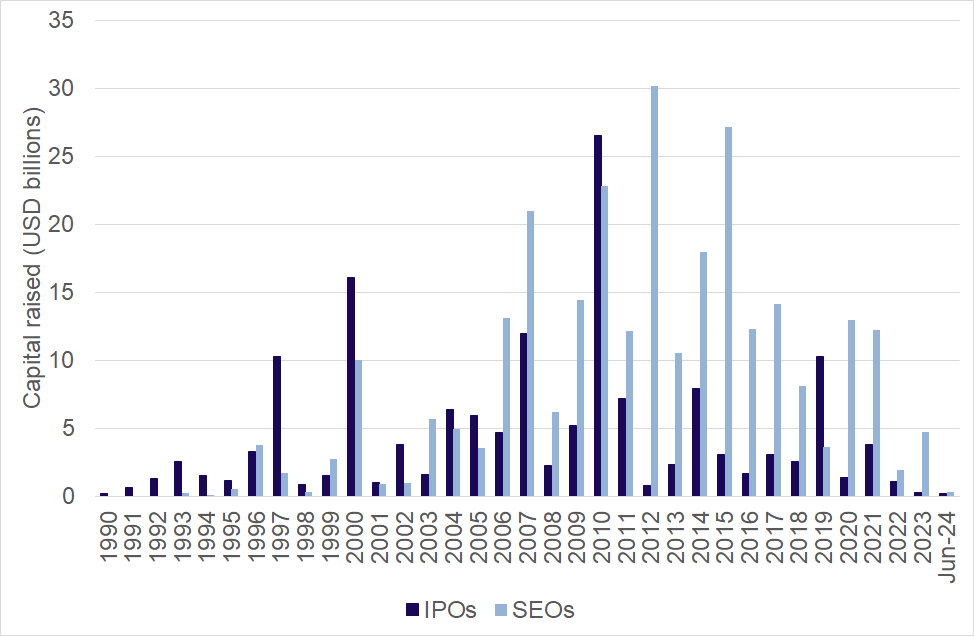
Source: Bloomberg
Figure 37: Capital raised in IPOs and SEOs in China
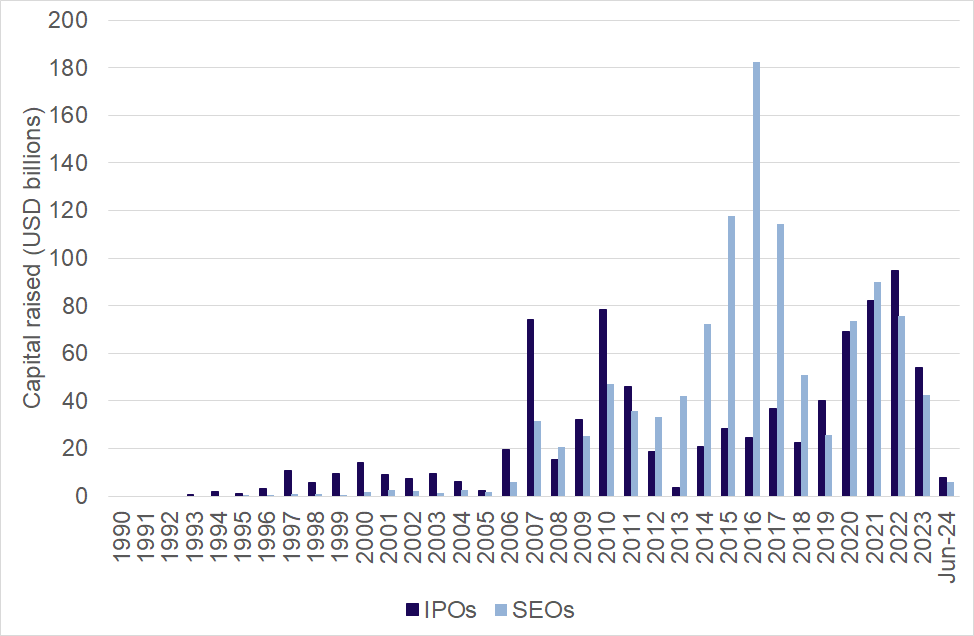
Source: Bloomberg
Appendix B. Additional information about private capital
Figure 38: Australia-focused private capital fund raising
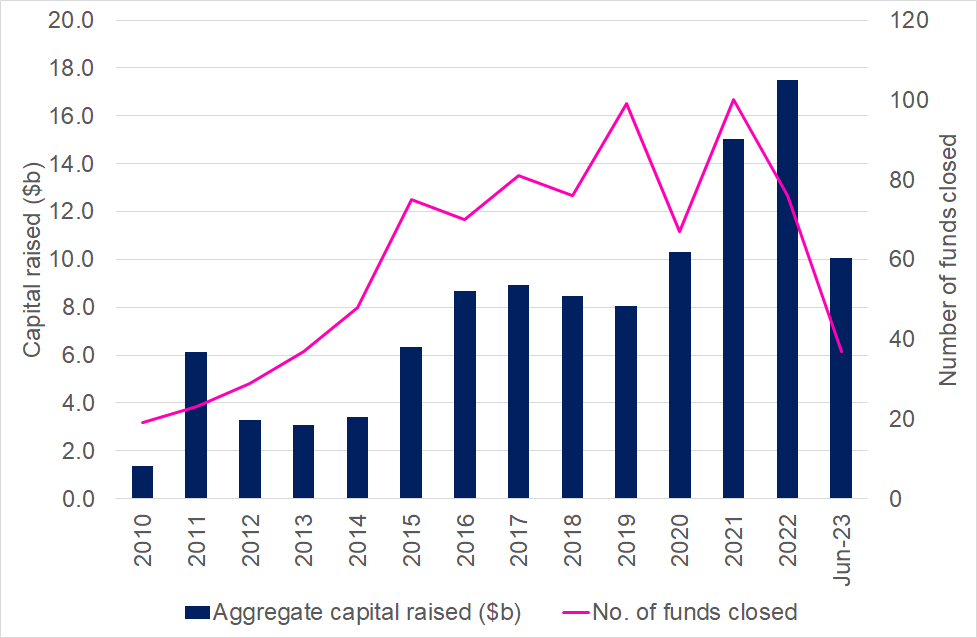
Source: Preqin and AIC Yearbook 2024
References
Albuquerque R, J. Cassel, L. Phalippou, E. Schroth, 2018. Liquidity provision in the secondary market for private equity fund stakes. Working paper, Available at SSRN.
Aragon, G., Li, E., Lindsay, L., 2023. Hedge fund investment in venture capital. Working paper
Asker, J., J. Farre-Mensa, A. Ljungqvist. 2015. Corporate investment and stock market listing: A puzzle? Review of Financial Studies 28:342–90.
Australian Private Capital Market Overview: A Preqin and Australian Investment Council Yearbook 2024.
Bae, K, W. Bailey, J. Kang, 2021, Why is stock market concentration bad for the economy? Journal of Financial Economics 140, 436–459.
Bain & Company, 2024, Global Private Equity Report 2024.
Begenau, J., P. Liang, P., E. Siriwardane, 2024. The rise in alternatives, Stanford University Graduate School of Business Research Paper, Available at SSRN.
Bernstein, S., 2022. The Effects of Public and Private Equity Markets on Firm Behavior, Annual Review of Financial Economics 14,295-318.
Bollen N., B. Sensoy, 2022. How much for a haircut? Illiquidity, secondary markets, and the value of private equity. Financial Management 51, 501–538
Bond, P., Edmans, A., Goldstein, I., 2012. The real effects of financial markets. Annu. Rev. Finan. Econ. 4 (1), 339–360.
Boyer, B. H., T. Nadauld, K. Vorkink, M. S. Weisbach. 2023. Discount-Rate Risk in Private Equity: Evidence from Secondary Market Transactions. Journal of Finance 78 (2):835–85.
Brau, J., S. Fawcett. 2006. Initial public offerings: An analysis of theory and practice. Journal of Finance 61:399–436.
Brugler, J., C. Comerton-Forde, J.S, Martin, 2022. Secondary Market Transparency and Corporate Bond Issuing Costs. Review of Finance 26(1): 43-77.
Brugler, J., C. Comerton-Forde, T. Hendershott, 2021. Does Financial Market Structure Impact the Cost of Capital? Journal of Financial and Quantitative Analysis 56(5):1771-1808.
Caglio, C., K. Hanley, J. Marietta-Westberg, 2016. Going public abroad. Journal of Corporate Finance 41, 103-122.
Coles, J., D. Naveen and L. Naveen, 2022, Survey of Boards’ Monitoring and Advisory Roles (August 1, 2022). Available at SSRN.
Dambra, M., Field, L.C., Gustafson, M.T., 2015. The JOBS Act and IPO volume: Evidence that disclosure costs affect the IPO decision. Journal of Financial Economics 116, 121–143.
de Fontenay, E. 2017. The deregulation of private capital and the decline of the public company. Hastings Law Journal 68:445–502.
Deloitte Actuaries and Consultants, 2024, Dynamics of the Australian Superannuation System The next 20 years to 2043.
Dimson, E., P. Marsh, M. Staunton, Global, 2024, Summary Edition Leveraging deep history to navigate the future, UBS Global Investment Returns Yearbook 2024.
Doidge, C., K. Kahle, A. Karolyi, R. Stulz. 2009. Has New York become less competitive than London in global markets? Evaluating foreign listing choices over time. Journal of Financial Economics 91(3), 253-277.
Doidge, C., K. Kahle, A. Karolyi, R. Stulz. 2018. Eclipse of the public corporation or eclipse of the public markets? Journal of Applied Corporate Finance 30:8–16.
Doidge, C., A. Karolyi, R. Stulz. 2013. The U.S. left behind? Financial globalization and the rise of IPOs outside the U.S. Journal of Financial Economics110:546–573.
Doidge, C., A. Karolyi, and R. Stulz. 2017. The U. S. listing gap. Journal of Financial Economics 123:464–487.
Driessen, J., T.-C. Lin, L. Phalippou. 2012. A New Method to Estimate Risk and Return of Nontraded Assets from Cash Flows: The Case of Private Equity Funds. Journal of Financial and Quantitative Analysis 47 (3):511–35.
Engelen, P.J., Meoli, M., Signori, A., Vismara, S., 2020. The effects of stricter regulation on the going public decision of small and knowledge-intensive firms. Journal of Business Finance and Accounting 47 (1–2), 188–217.
Ewens, M., Farre-Mensa, J., 2020. The deregulation of the private equity markets and the decline in IPOs. Review of Financial Studies 33, 5463 – 5509.
Ewens, M., Farre-Mensa, J., 2022. Private or public equity? The evolving entrepreneurial landscape. Annual Review of Financial Economics 14.
Ewens, M., C. M. Jones, M. Rhodes-Kropf. 2013. The Price of Diversifiable Risk in Venture Capital and Private Equity. Review of Financial Studies 26 (8):1854–89
Ewens, M., N. Malenko. 2024, Board Dynamics Over the Startup Life Cycle. European Corporate Governance Institute – Finance Working Paper No. 687/2020, Available at SSRN.
Ewens, M., K. Xiao, T. Xu. 2024. Regulatory Costs of Being Public: Evidence from Bunching Estimation. Journal of Financial Economics 153, 103775.
Financial Regulator Assessment Authority, Effectiveness and Capability Review of the Australian Prudential Regulation Authority, June 2023.
Gao, X., J. Ritter, Z. Zhu. 2013. Where have all the IPOs gone?Journal of Financial and Quantitative Analysis 48:1663–1692.
Georgiev, G., 2021. The breakdown of the public-private divide in securities law: Causes, consequences and reforms. New York University Journal of Law and Business 18 (1).
Gilbey, K., Marsh, T., Purchase, S. 2022. ASX small firm/ listings: the IPO ‘Pop’ and two decades of subsequent returns, Accounting and Finance 62(3), 3285-3318.
Georgiev, G., 2023. Is “Public Company” Still a Viable Regulatory Category? Harvard Business Law Review 13(1).
Goldman Sachs, 2024, Top of Mind, Market Concentration: How big a worry, Goldman Sachs Global Macro Research, Issue 133, 25 November 2024.
Gozlugol, A., J. Greth, T. Troger, 2023. Oscillating Domains of Public and Private Markets, ECGI Law Working Paper N 689/2023.
Gupta, A., S. van Nieuwerburgh. 2021. Valuing Private Equity Investments Strip by Strip. Journal of Finance 76 (6):3255–307.
Harris J.,E. Chow, 2024, The Private Equity Market in Australia, Reserve Bank Bulletin – April 2024.
Harris, R. S., T. Jenkinson, S. N. Kaplan. 2014. Private Equity Performance: What Do We Know? Journal of Finance 69 (5):1851–82.
Harris, R. S., T. Jenkinson, S. N. Kaplan. 2021. How Do Private Equity Investments Perform Compared to Public Equity? Darden Business School Working Paper No. 2597259, Available at SSRN.
Hege U., A. Nuti, 2011. The private equity secondaries market during the financial crisis and the ‘Valuation Gap’. Journal of Private Equity 14(3), 42–54.
HM Treasury, 2024. Private Intermittent Securities and Capital Exchange System (PISCES): Consultation.
Ivashina, V., J. Lerner, 2018. Looking for Alternatives: Pension Investments around the World, 2008 to 2017, Harvard Business School Working Paper.
Kahle, K.M., Stulz, R.M., 2017. Is the US public corporation in trouble? Journal of Economic Perspectives 31, 67–88.
Kwon, S., M. Lowry, Y. Qian. 2020. Mutual fund investments in private firms. Journal of Financial Economics 136:407–43.
Lamont, O., 2024, Higher Stock Market Concentration Does Not Mean Higher Risk, Owenomics, Acadian, March 2024.
Lattanzio, G., W. Megginson, A. Sanati, 2023. Dissecting the listing gap: mergers, private equity or regulation? Journal of Financial Markets 65: 100836.
Lerner, J., A. Schoar. 2004. The Illiquidity Puzzle: Theory and Evidence from Private Equity. Journal of Financial Economics 72 (1):3–40.
Leuz, C., 2007. Was the Sarbanes–Oxley Act of 2002 really this costly? A discussion of evidence from event returns and going-private decisions. Journal of Accounting and Economics 44, 146–165.
Leuz, C., Triantis, A., Wang, T.Y., 2008. Why do firms go dark? Causes and economic consequences of voluntary SEC deregistrations. Journal of Accounting and Economics 45, 181–208.
Leuz, C., Wysocki, P.D., 2016. The economics of disclosure and financial reporting regulation: Evidence and suggestions for future research. Journal of Accounting Research 54, 525–622.
Levine, R. 2005. Finance and Growth: Theory and Evidence. Handbook of Economic Growth, 1, 865-934.
Levine, R., Zervos, S., 1998. Stock markets, banks, and economic growth. Amer. Econ. Rev. 88 (3), 537.
Ljungqvist, A. 2024. The economics of Private Equity: A critical review. CFA Institute Research Foundation.
Ljungqvist, A., Persson, L., Tåg, J., 2018. The Incredible Shrinking Stock Market: On the Political Economy Consequences of Excessive Delistings. European Corporate Governance Institute (ECGI)-Finance Working Paper 458.
Lowry, M., 2024. The Blurring Lines between Private and Public Ownership. Handbook of Corporate Finance, edited by David Denis.
Marsh, T., K. Gilbey, 2024. Australian initial public offerings and US venture capital: different structures for similar early-stage funding? Journal of Accounting Literature 46(1), 105-120.
Mason, P., S. Utke., 2023, Private Equity Secondary Markets. The Palgrave Encyclopedia of Private Equity.
Mauboussin, M., D. Callahan, 2023. Birth, Death and Wealth Creation: Why Investors Need to Understand Corporate Demographics, Morgan Stanley Investment Management, July.
Mauboussin, M., D. Callahan, 2024. Stock Market Concentration How Much Is Too Much?, Morgan Stanley Investment Management, June.McKinsey Global Private Markets Review 2024: Private markets in a slower era.
Nadauld, T. D., B. A. Sensoy, K. Vorkink, M. S. Weisbach., 2019. The Liquidity Cost of Private Equity Investments: Evidence from Secondary Market Transactions. Journal of Financial Economics 132 (3):158–81.
Oppenheimer, P., G. Jaisson, S. Bell, M. von Scheele, L. Peytavin, 2024, The Concentration Conundrum: What to do about market dominance, Goldman Sachs, Global Strategy Paper 66, March.
Partnoy, F., 2018. The death of the IPO. November. The Atlantic.
Phalippou, L., 2020. An inconvenient fact: PE performance and the billionaire factory, Journal of Investing 30(1), 11-39.
Phalippou, L. M. Umber, C. Rauch, 2018. Private Equity Portfolio Company Fees. Journal of Financial Economics 129(3), 559-585.
Roe, M.,C. Wang, 2024, Half the Firms, Double the Profits: Public Firms' Transformation, 1996-2022. Journal of Law, Finance, and Accounting, Forthcoming, European Corporate Governance Institute – Law Working Paper No. 771/2024, Available at SSRN.
Sanati, A., I. Spyridopoulos, 2024. Comparing Capital Allocation Efficiency in Public and Private Equity Markets, Available at SSRN.
Stulz, R.M., 2020. Public versus private equity. Oxford Review of Economic Policy, 36(2), pp.275-290.
Wurgler, J., 2000. Financial markets and the allocation of capital. Journal of Financial Economics 58 (1–2), 187–214.
Zhang, I.X., 2007. Economic consequences of the Sarbanes–Oxley Act of 2002. Journal of Accounting and Economics 44, 74–115.