Equity market data for quarter ending December 2014
For an explanation of the measures used in this release, see Information Sheet 177 Quarterly cash equity market data: Methodology and definitions (INFO 177).
Summary
Summary of December quarter data
Tables
Table 1 - Market characteristics - average for December quarter
Table 2 - Measures of market concentration
Table 3 - Measures of market efficiency
Graphs
Figure 1: Market share - December quarter 2014
Figure 2: Australia - Average daily turnover
Figure 3: Average trade size by execution venue
Figure 4: Dark liquidity proportion of total value traded
Figure 5: Order-to-trade ratio
Figure 6: Intraday trading profile
Figure 10: Effective bid-ask spreads
Figure 11: Quoted bid-ask spreads
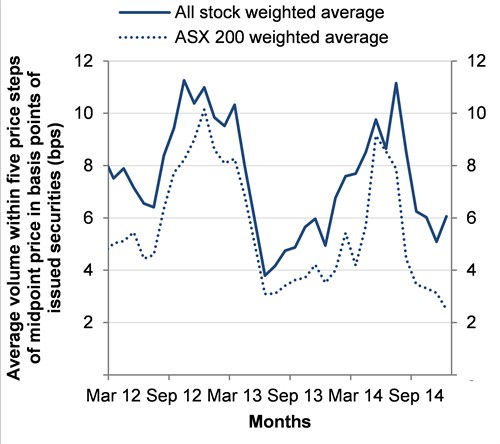
Figure 12: Depth at five price steps as basis points of issued securities
Equity market data from other quarters
Summary of December quarter data
In the December quarter 2014, the ASX accounted for 82.5% of the total dollar turnover in equity market products. Chi-X accounted for the remaining 17.5% of total dollar turnover. These figures include all trades executed on order book, as well as trades matched off order book and reported to either market operator. Chi-X trade reporting fell by 7% over the past quarter, while ASX trade reporting fell by just under 15% compared to the previous quarter.
Overall daily turnover in the equity market averaged $4.9 billion in the December quarter unchanged from the previous quarter. The weighted average quoted bid-ask spread for securities in the ASX200 index decreased marginally to 13.9 basis points of the midpoint price in the December quarter. Similarly, the weighted average quoted bid-ask spread for all securities decreased to 21.3 basis points of the midpoint price.
The Herfindahl index increased across the public order book and broker crossings during the quarter, showing a reduction in market fragmentation. Intraday and interday volatility trended higher in the quarter, peaking in December at the highest levels since June 2013. The overall order-to-trade ratio decreased to 8.1:1 in the quarter as both the ASX and Chi-X reported lower ratios.
Below block size dark liquidity represented 12% of total value traded in the December quarter, unchanged from the previous quarter, and above its share of the market a year prior (11%). Turnover in block size dark liquidity was 15% of total value traded, unchanged from the previous quarter.
Table 1 - Market characteristics - average for December quarter
| Statistics |
ASX on-order
book |
ASX auctions
|
ASX Centre Point
|
ASX trade
reporting |
Chi-X on-order
book |
Chi-X trade reporting
|
Total
|
|---|---|---|---|---|---|---|---|
| Number of trades per day (market share) |
606,550
(67.0%) |
24,877
(2.7%) |
67,763
(7.5%) |
10,909
(1.2%) |
142,567
(15.7%) |
53,184
(5.9%) |
905,851
(100.0%) |
| Value traded, $ million/day (market share) |
2,537.1
(52.1%) |
721.0
(14.8%) |
278.3
(5.7%) |
479.0
(9.8%) |
401.6
(8.2%) |
451.6
(9.3%) |
4,868.6
(100.0%) |
| Order-to-trade ratio |
6.1
|
na
|
na
|
na
|
16.8
|
na
|
8.1
|
| Average trade size, $/trade |
4,183
|
29,097
|
4,133
|
50,373
|
2,807
|
8,672
|
5,380
|
Table 2 - Measures of market concentration
| Statistics |
December 2013
|
October 2014
|
November 2014
|
December 2014
|
|---|---|---|---|---|
| Total market Herfindahl index |
0.44
|
0.43
|
0.45
|
0.50
|
| Public venues Herfindahl index |
0.71
|
0.68
|
0.69
|
0.74
|
Table 3 - Measures of market efficiency
| Statistics |
December 2013
|
October 2014
|
November 2014
|
December 2014
|
|---|---|---|---|---|
| Quoted bid-ask spread, bps - All stocks - S&P/ASX 200 stocks |
21.9
15.3 |
21.4
13.7 |
21.0
13.4 |
21.7
14.7 |
| Effective bid-ask spread, bps - All stocks - S&P/ASX 200 stocks |
19.5
13.3 |
17.9
11.0 |
17.8
11.1 |
18.1
12.1 |
| Depth at best 5 price steps - all stocks, bps - All stocks - S&P/ASX 200 stocks |
4.9
3.5 |
6.0
3.3 |
5.1
3.1 |
6.1
2.5 |
Figure 1: Market share - December quarter 2014
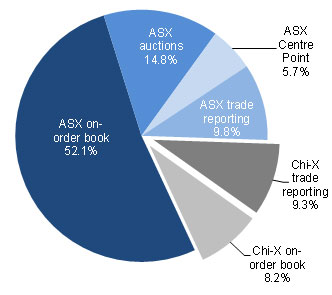
Figure 2: Australia - Average daily turnover
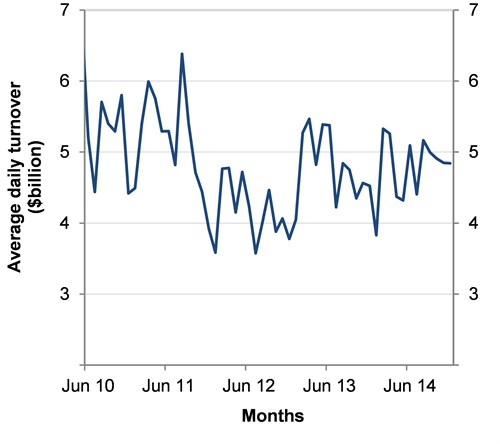
Figure 3: Average trade size by execution venue
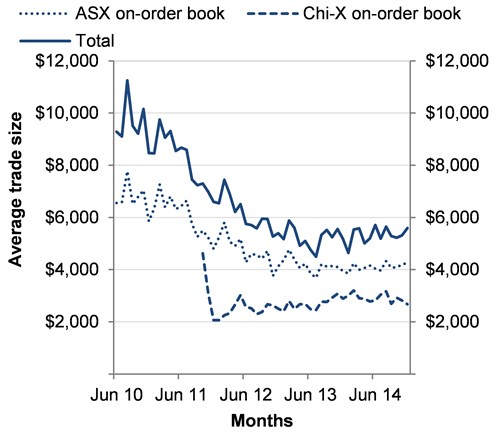
Figure 4: Dark liquidity proportion of total value traded
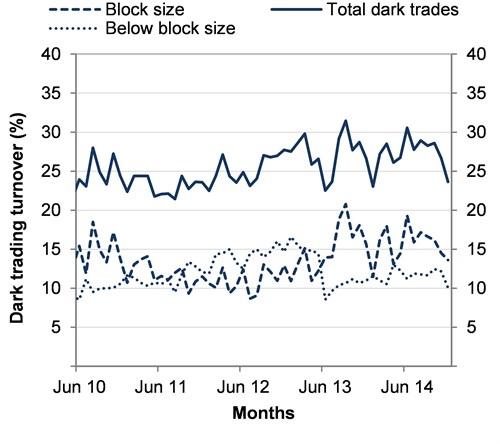
Figure 5: Order-to-trade ratio
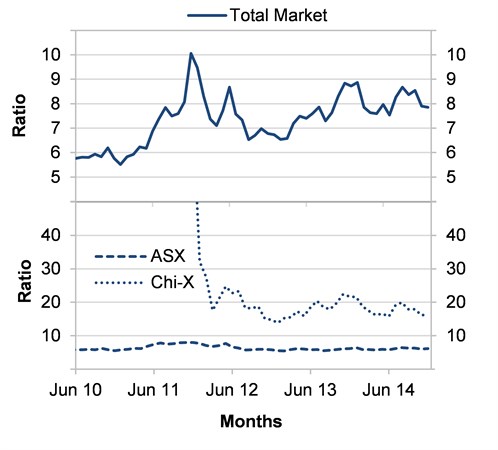
Figure 6: Intraday trading profile - December quarter 2014
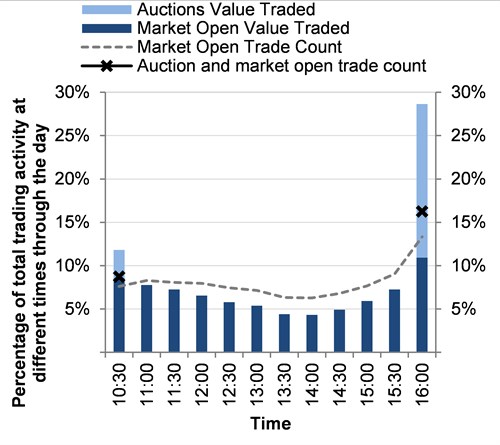
Figure 7: Intraday volatility
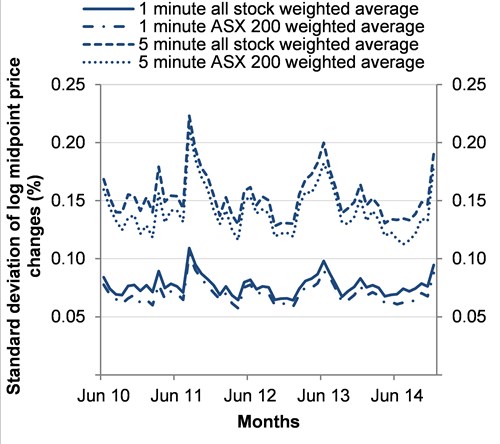
Figure 8: Interday volatility
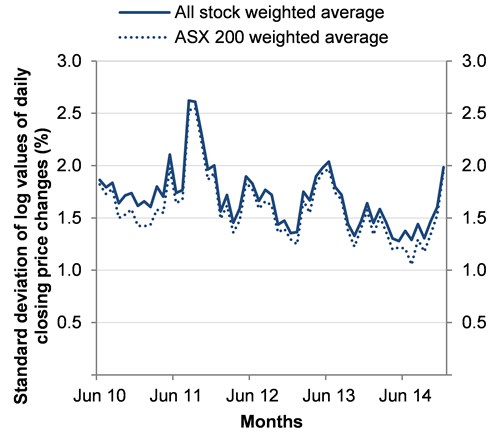
Figure 9: Herfindahl index
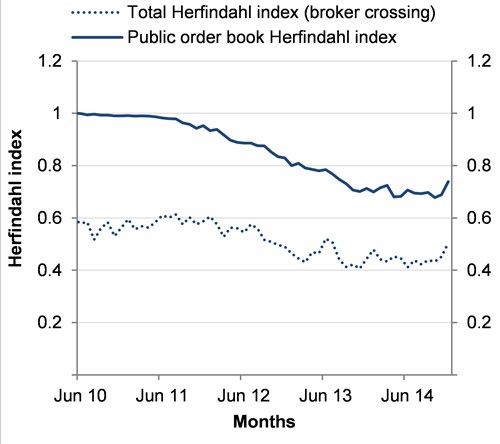
Figure 10: Effective bid-ask spreads
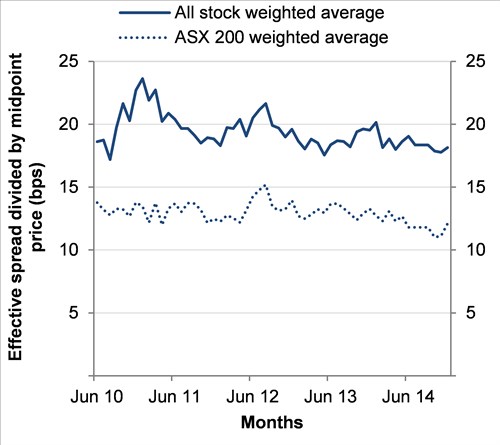
Figure 11: Quoted bid-ask spreads
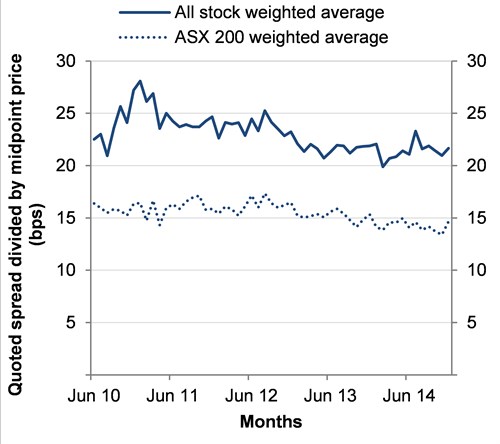
Figure 12: Depth at five price steps as basis points of issued securities