ASIC media releases are point-in-time statements. Please note the date of issue and use the internal search function on the site to check for other media releases on the same or related matters.

11–246MR Attachment - ASIC data shows rise in insolvency appointments
Chart 1 — Companies entering EXAD by quarter
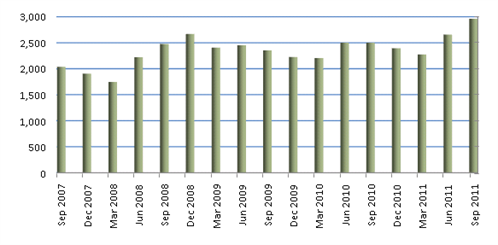
Table 1— Companies entering into EXAD by region
|
State / Territory |
Sept Qtr 2010 |
June Qtr 2011 |
Sept Qtr 2011 |
% |
% change Sept Qtr 2010 |
June Qtr 2011 |
|---|---|---|---|---|---|---|
|
NSW |
1,073 |
1,097 |
1,247 |
42.1% |
16.2% |
13.7% |
|
Vic |
667 |
706 |
719 |
24.3% |
7.8% |
1.8% |
|
Qld |
474 |
504 |
564 |
19.0% |
19.0% |
11.9% |
|
AS |
88 |
112 |
129 |
4.4% |
46.6% |
15.2% |
|
WA |
146 |
176 |
218 |
7.4% |
49.3% |
23.9% |
|
Tas |
22 |
21 |
28 |
0.9% |
27.3% |
33.3% |
|
NT |
9 |
12 |
8 |
03% |
-11.1% |
-33.3% |
|
ACT |
23 |
28 |
48 |
1.6% |
108.7% |
71.4% |
|
Total |
2,502 |
2,656 |
2,961 |
18.3% |
11.5% |
NB: ASIC notes that percentage changes in smaller regions can be unduly influenced by a relatively small number of appointments.
New South Wales (+16.2%) Victoria (+7.8%), Queensland (+19%), South Australia (+46.6%), Western Australia (+49.3%), Tasmania (+27.3%) and ACT (108.7%) recorded an increase over the same quarter in the past financial year.
Only the Northern Territory (-11.1%) experienced a decline in EXADs.
Table 2 —Companies entering into EXAD by appointment type for the quarter ended 30 September 2011*
|
|
Sept Qtr 010 |
June Qtr 2011 |
Sept Qtr 2011 |
% change Sept Qtr 2010 |
% change June Qtr 2011 |
|---|---|---|---|---|---|
|
|
727 |
683 |
913 |
25.5% |
33.7% |
|
|
1,064 |
1,228 |
1,271 |
19.5% |
3.5% |
|
|
359 |
346 |
390 |
8.6% |
12.7% |
|
|
351 |
399 |
387 |
10.3% |
-3.0% |
|
|
2,501 |
2,656 |
2,961 |
18.3% |
11.5% |
* excludes: scheme administrator and foreign/RAB wind-ups; and members voluntary liquidation appointments as these relate to solvent entities
Includes:
(1) provisional liquidations, and
(2) receivers, receivers and managers, controllers and managing controllers.
View the full monthly insolvency statistics
Back to 11-246MR